
Gambaran keseluruhan
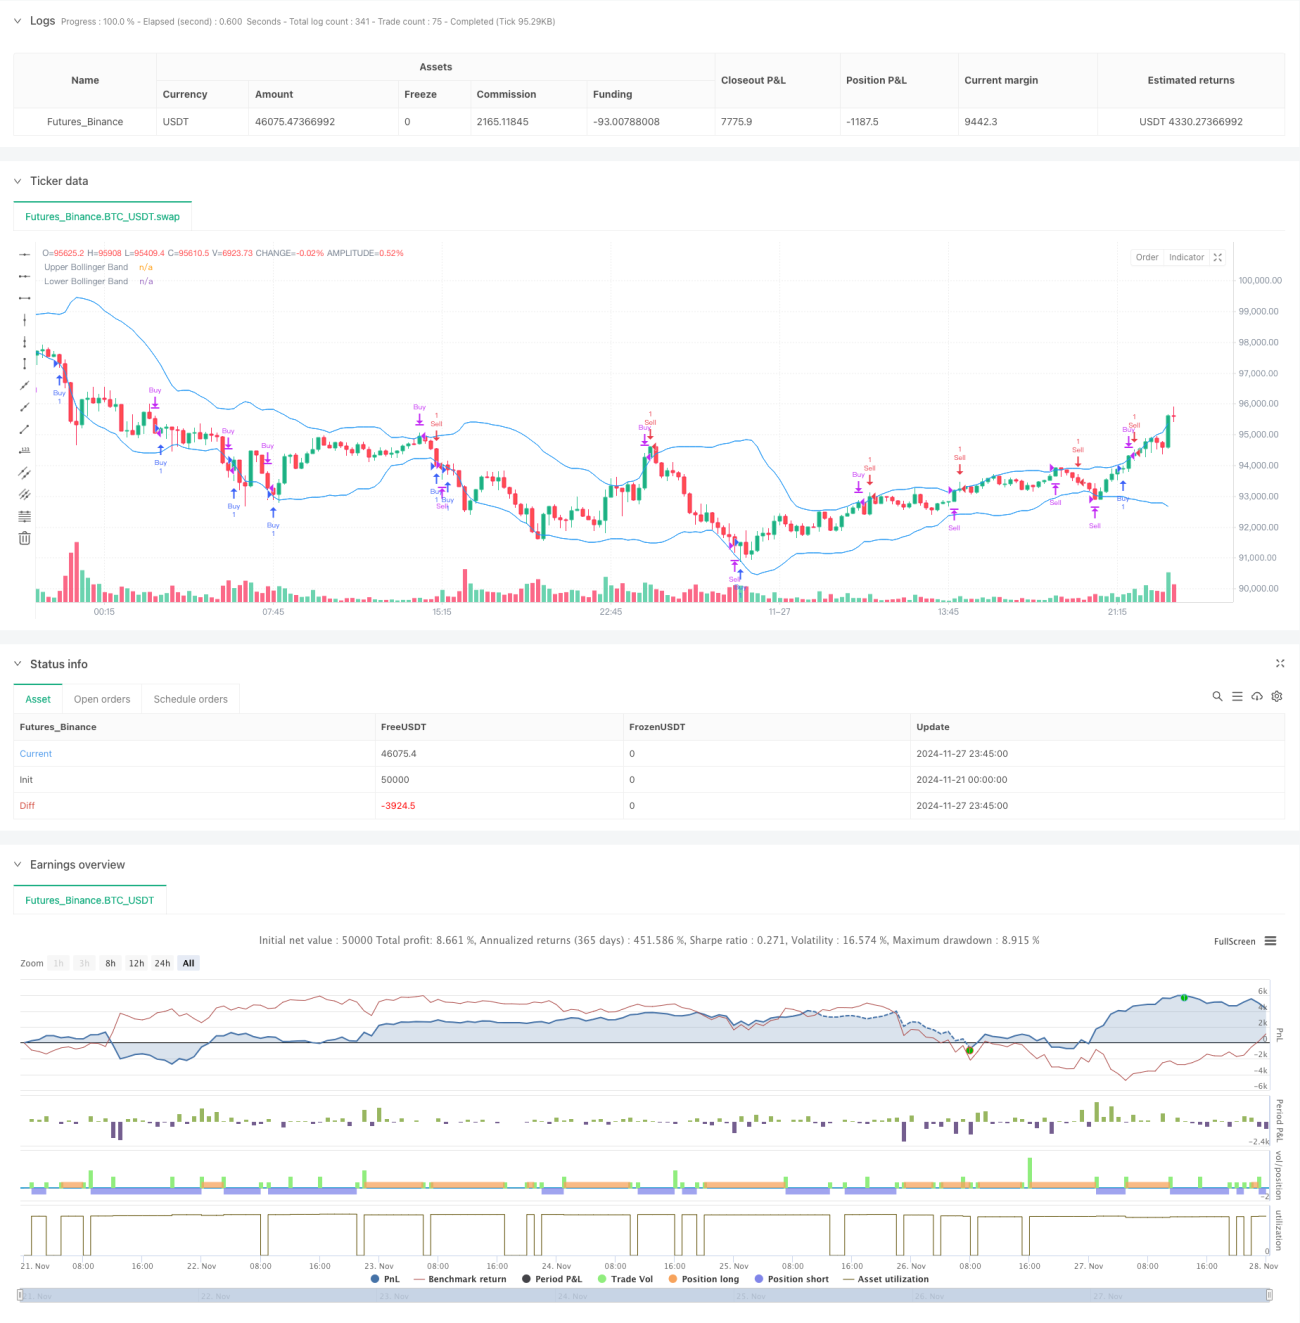
Strategi ini adalah sistem perdagangan komprehensif berdasarkan pelbagai petunjuk teknikal, yang menangkap trend pasaran dan peluang pembalikan dengan menggabungkan beberapa petunjuk teknikal seperti MACD, RSI, Brin Belt dan ATR. Strategi ini menggunakan skema berhenti dan keuntungan yang dinamik, yang dapat menyesuaikan parameter perdagangan mengikut turun naik pasaran, dan mengawal risiko dengan berkesan sambil menjamin keuntungan. Hasil tinjauan semula menunjukkan bahawa strategi ini mencapai kadar keuntungan 676.27% semasa ujian tiga bulan terakhir, menunjukkan kebolehpasaran pasaran yang baik.
Prinsip Strategi
Strategi ini menggunakan sistem pengesahan indikator teknikal berlapis, termasuk:
- MACD ((12,26,9) digunakan untuk menangkap isyarat peralihan kuantiti, menghasilkan isyarat beli apabila MACD melintasi garis isyarat, menghasilkan isyarat jual apabila melintasi garis isyarat
- RSI ((14) sebagai penapis sekunder, di bawah 35 dianggap sebagai kawasan oversold, di atas 65 dianggap sebagai kawasan overbought
- Blink band ((20,2) digunakan untuk mengenal pasti kawasan pergerakan harga, mempertimbangkan untuk membeli apabila harga menyentuh rel bawah, mempertimbangkan untuk menjual apabila ia menyentuh rel atas
- ATR digunakan untuk menetapkan tahap stop loss dan profit secara dinamik, dengan stop loss ditetapkan 3 kali ATR, dan profit sasaran ditetapkan 5 kali ATR
Logik dagangan menggabungkan strategi trend-following dan perdagangan reverse untuk meningkatkan ketepatan dagangan melalui pengesahan berganda. Sistem ini secara automatik menyesuaikan tahap stop loss dan keuntungan berdasarkan turun naik pasaran dalam masa nyata, untuk mencapai pengoptimuman dinamik pengurusan risiko.
Kelebihan Strategik
- Sistem pengesahan isyarat berbilang dimensi meningkatkan kebolehpercayaan transaksi
- Skema Stop Loss Profit Dinamik Sesuai Dengan Keadaan Pasaran Berbeza
- Mengintegrasikan pemikiran perdagangan trend dan reversal untuk meningkatkan peluang perdagangan
- Sistem pengurusan risiko automatik mengurangkan kesalahan pertimbangan manusia
- Kemenangan 53.99% dan faktor keuntungan 1.44 menunjukkan strategi yang stabil
- Strategi menyokong peringatan dagangan dalam masa nyata untuk memudahkan pedagang
Risiko Strategik
- Multiple indicators boleh menyebabkan isyarat terlewat, kehilangan peluang dalam pasaran yang cepat
- Kadar pengeluaran maksimum 56.33% memerlukan ketahanan risiko yang lebih tinggi
- Perdagangan yang kerap mungkin membawa kepada kos yang lebih tinggi
- Strategi mungkin menghadapi risiko yang lebih besar dalam pasaran yang bergolak
Cadangan kawalan risiko:
- Menjalankan pelan pengurusan dana yang ketat
- Semak dan ubah parameter secara berkala
- Penangguhan perdagangan semasa data penting diumumkan
- Tetapkan had kerugian maksimum setiap hari
Arah pengoptimuman strategi
-
Optimasi parameter:
- Parameter penunjuk untuk dipertimbangkan menggunakan kitaran penyesuaian
- Mengoptimumkan penyetempatan ATR untuk meningkatkan risiko dan ganjaran
-
Peningkatan sistem isyarat:
- Tambahkan pengesahan metrik penukaran
- Pengenalan penunjuk sentimen pasaran
-
Pengoptimuman Pengurusan Risiko:
- Realisasikan pengurusan jawatan yang dinamik
- Menambah penapis masa
-
Peningkatan teknologi:
- Menambah penapis kadar turun naik pasaran
- Optimumkan penghakiman masa masuk dan keluar
ringkaskan
Strategi ini mencapai kesan perdagangan yang lebih baik melalui gabungan pelbagai petunjuk teknikal dan sistem pengurusan risiko yang dinamik. Walaupun terdapat risiko penarikan balik tertentu, strategi ini menunjukkan adaptasi dan kestabilan pasaran yang baik melalui kawalan risiko yang ketat dan pengoptimuman berterusan.
- 1