
Gambaran keseluruhan
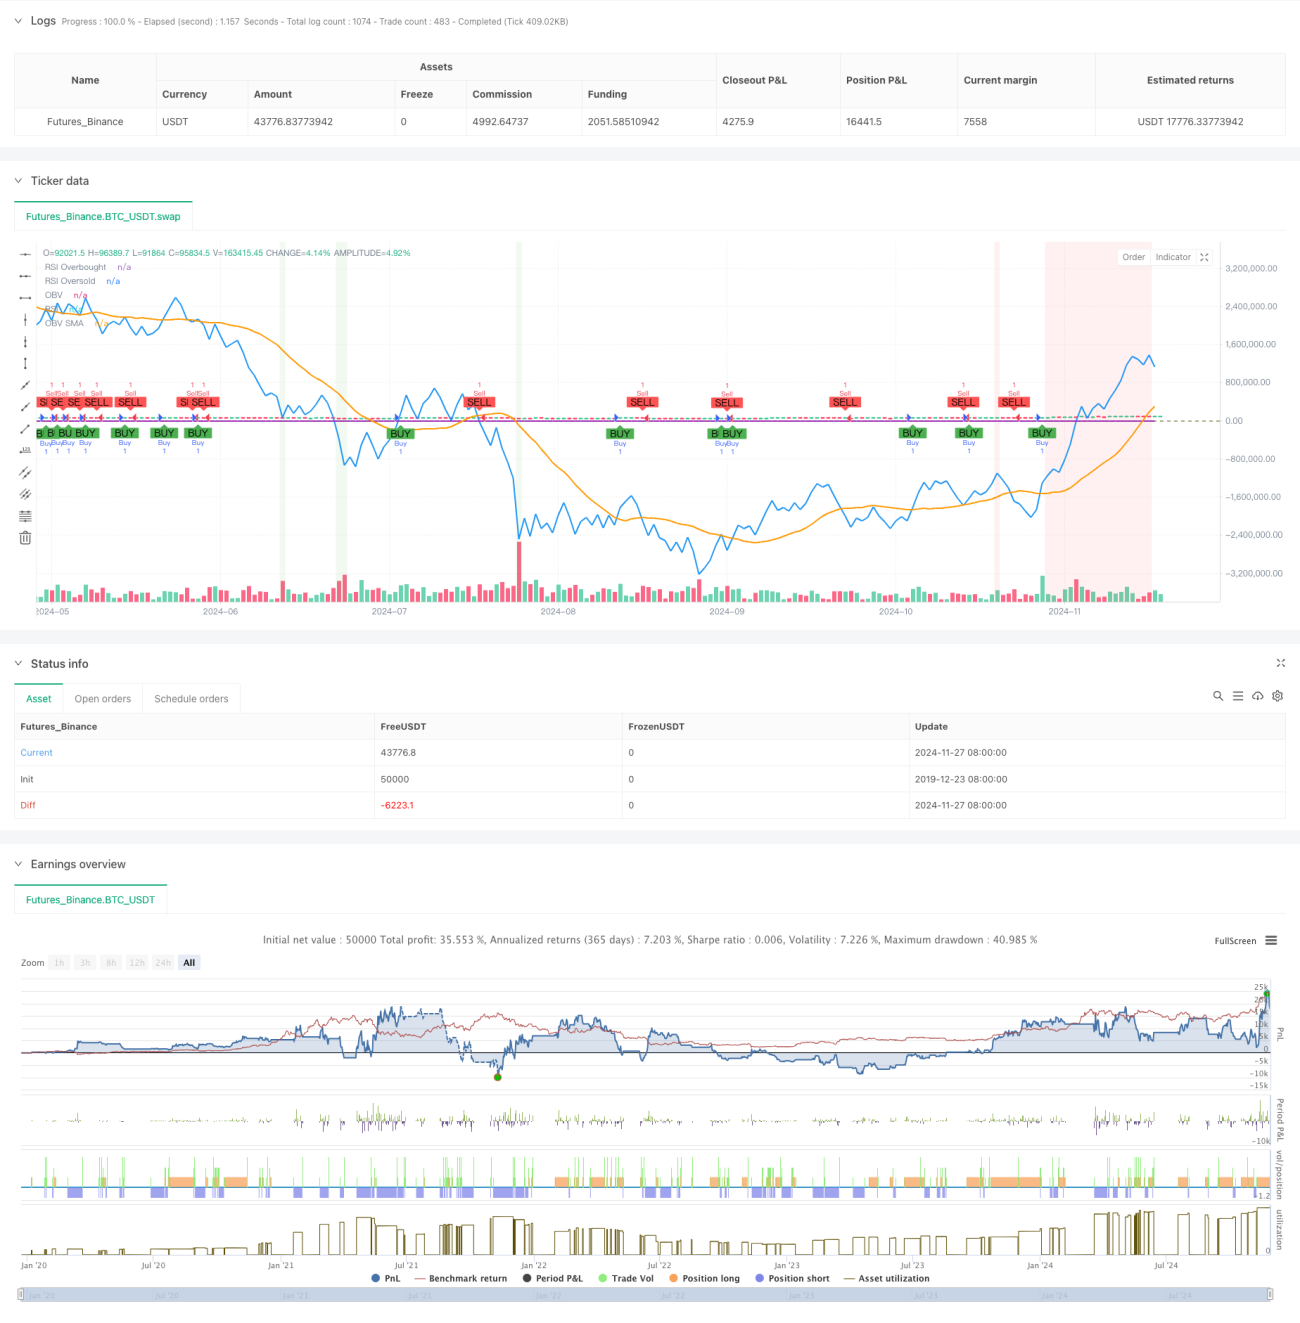
Strategi ini adalah sistem perdagangan momentum multidimensi yang menggabungkan indikator tenaga berganda (OBV), purata bergerak (SMA) dan indikator yang agak kuat (RSI). Strategi ini menangkap pergerakan pasaran dengan memantau tanda silang OBV dan rata-rata bergeraknya, sambil menggunakan indikator RSI untuk menyaring, yang berkesan mengelakkan penembakan yang berlebihan. Strategi ini juga mengintegrasikan peratusan stop loss dan mekanisme keuntungan, mencapai pengurusan keseimbangan risiko-keuntungan.
Prinsip Strategi
Strategi ini berpusat pada tiga dimensi:
- Penunjuk OBV digunakan untuk mengukur sentimen pasaran bagi jumlah dagangan yang terkumpul, dengan mengira arah perubahan harga dan jumlah dagangan yang terkumpul untuk mencerminkan kekuatan beli dan jual di pasaran.
- Rata-rata bergerak 20 kitaran OBV digunakan sebagai garis asas, apabila OBV melintasi rata-rata bergerak ke atas dan RSI lebih rendah daripada 70, ia akan mencetuskan isyarat lebih; apabila OBV melintasi rata-rata bergerak ke bawah dan RSI lebih tinggi daripada 30, ia akan mencetuskan isyarat kosong.
- Pengenalan penunjuk RSI sebagai penapis untuk mengelakkan penempatan di kawasan overbought dan oversold yang berlebihan dan mengurangkan risiko penembusan palsu.
Strategi ini menggunakan peratusan yang tetap untuk menghentikan kerugian ((2%) dan sasaran keuntungan ((4%), dan kerangka pengurusan risiko simetri ini membantu mengekalkan nisbah risiko pendapatan yang stabil.
Kelebihan Strategik
- Mekanisme pengesahan isyarat multidimensi mengurangkan kesan isyarat palsu
- Menggabungkan jumlah transaksi, pergerakan harga dan indikator overbought dan oversold secara organik
- Rangka kerja pengurusan risiko yang jelas, sasaran berhenti rugi dan keuntungan yang tetap
- Logik strategi ringkas, jelas, mudah difahami dan dipelihara
- Reka bentuk visual yang baik, isyarat perdagangan dan penunjuk yang jelas
Risiko Strategik
- Kemungkinan sering mencetuskan hentian dalam pasaran yang bergolak tinggi
- Stop loss peratusan tetap mungkin tidak sesuai untuk semua keadaan pasaran
- Syarat penapisan RSI mungkin terlepas beberapa titik permulaan trend penting
- Penunjuk OBV mungkin menghasilkan isyarat yang menyesatkan dalam persekitaran kecairan yang rendah
- Strategi tidak mengambil kira kesan ciri kitaran pasaran
Arah pengoptimuman strategi
- Memperkenalkan mekanisme penangguhan yang beradaptasi, seperti penangguhan ATR atau penangguhan yang disesuaikan dengan kadar turun naik
- Menambah penapis trend, seperti garis purata jangka panjang untuk menentukan arah trend utama
- Mengoptimumkan parameter RSI untuk mempertimbangkan perubahan dinamik ke atas dan ke atas paras paras
- Tambah syarat penapisan jumlah pertukaran untuk memastikan isyarat dipicu di bawah sokongan jumlah pertukaran yang berkesan
- Pertimbangkan untuk menggunakan penapis masa untuk mengelakkan masa yang bergolak
- Menambah mekanisme pengurusan kedudukan untuk menyesuaikan kedudukan secara dinamik
ringkaskan
Ini adalah strategi perdagangan dinamika multidimensi yang dirancang dengan baik, dengan menggabungkan kelebihan indikator teknikal, untuk membina sistem perdagangan yang lengkap. Kelebihan utama strategi adalah mekanisme pengesahan isyarat bertingkat dan kerangka pengurusan risiko peraturan. Walaupun terdapat beberapa risiko yang berpotensi, strategi ini dapat ditingkatkan lagi dengan arah pengoptimuman yang disyorkan.
- 1