Gambaran keseluruhan
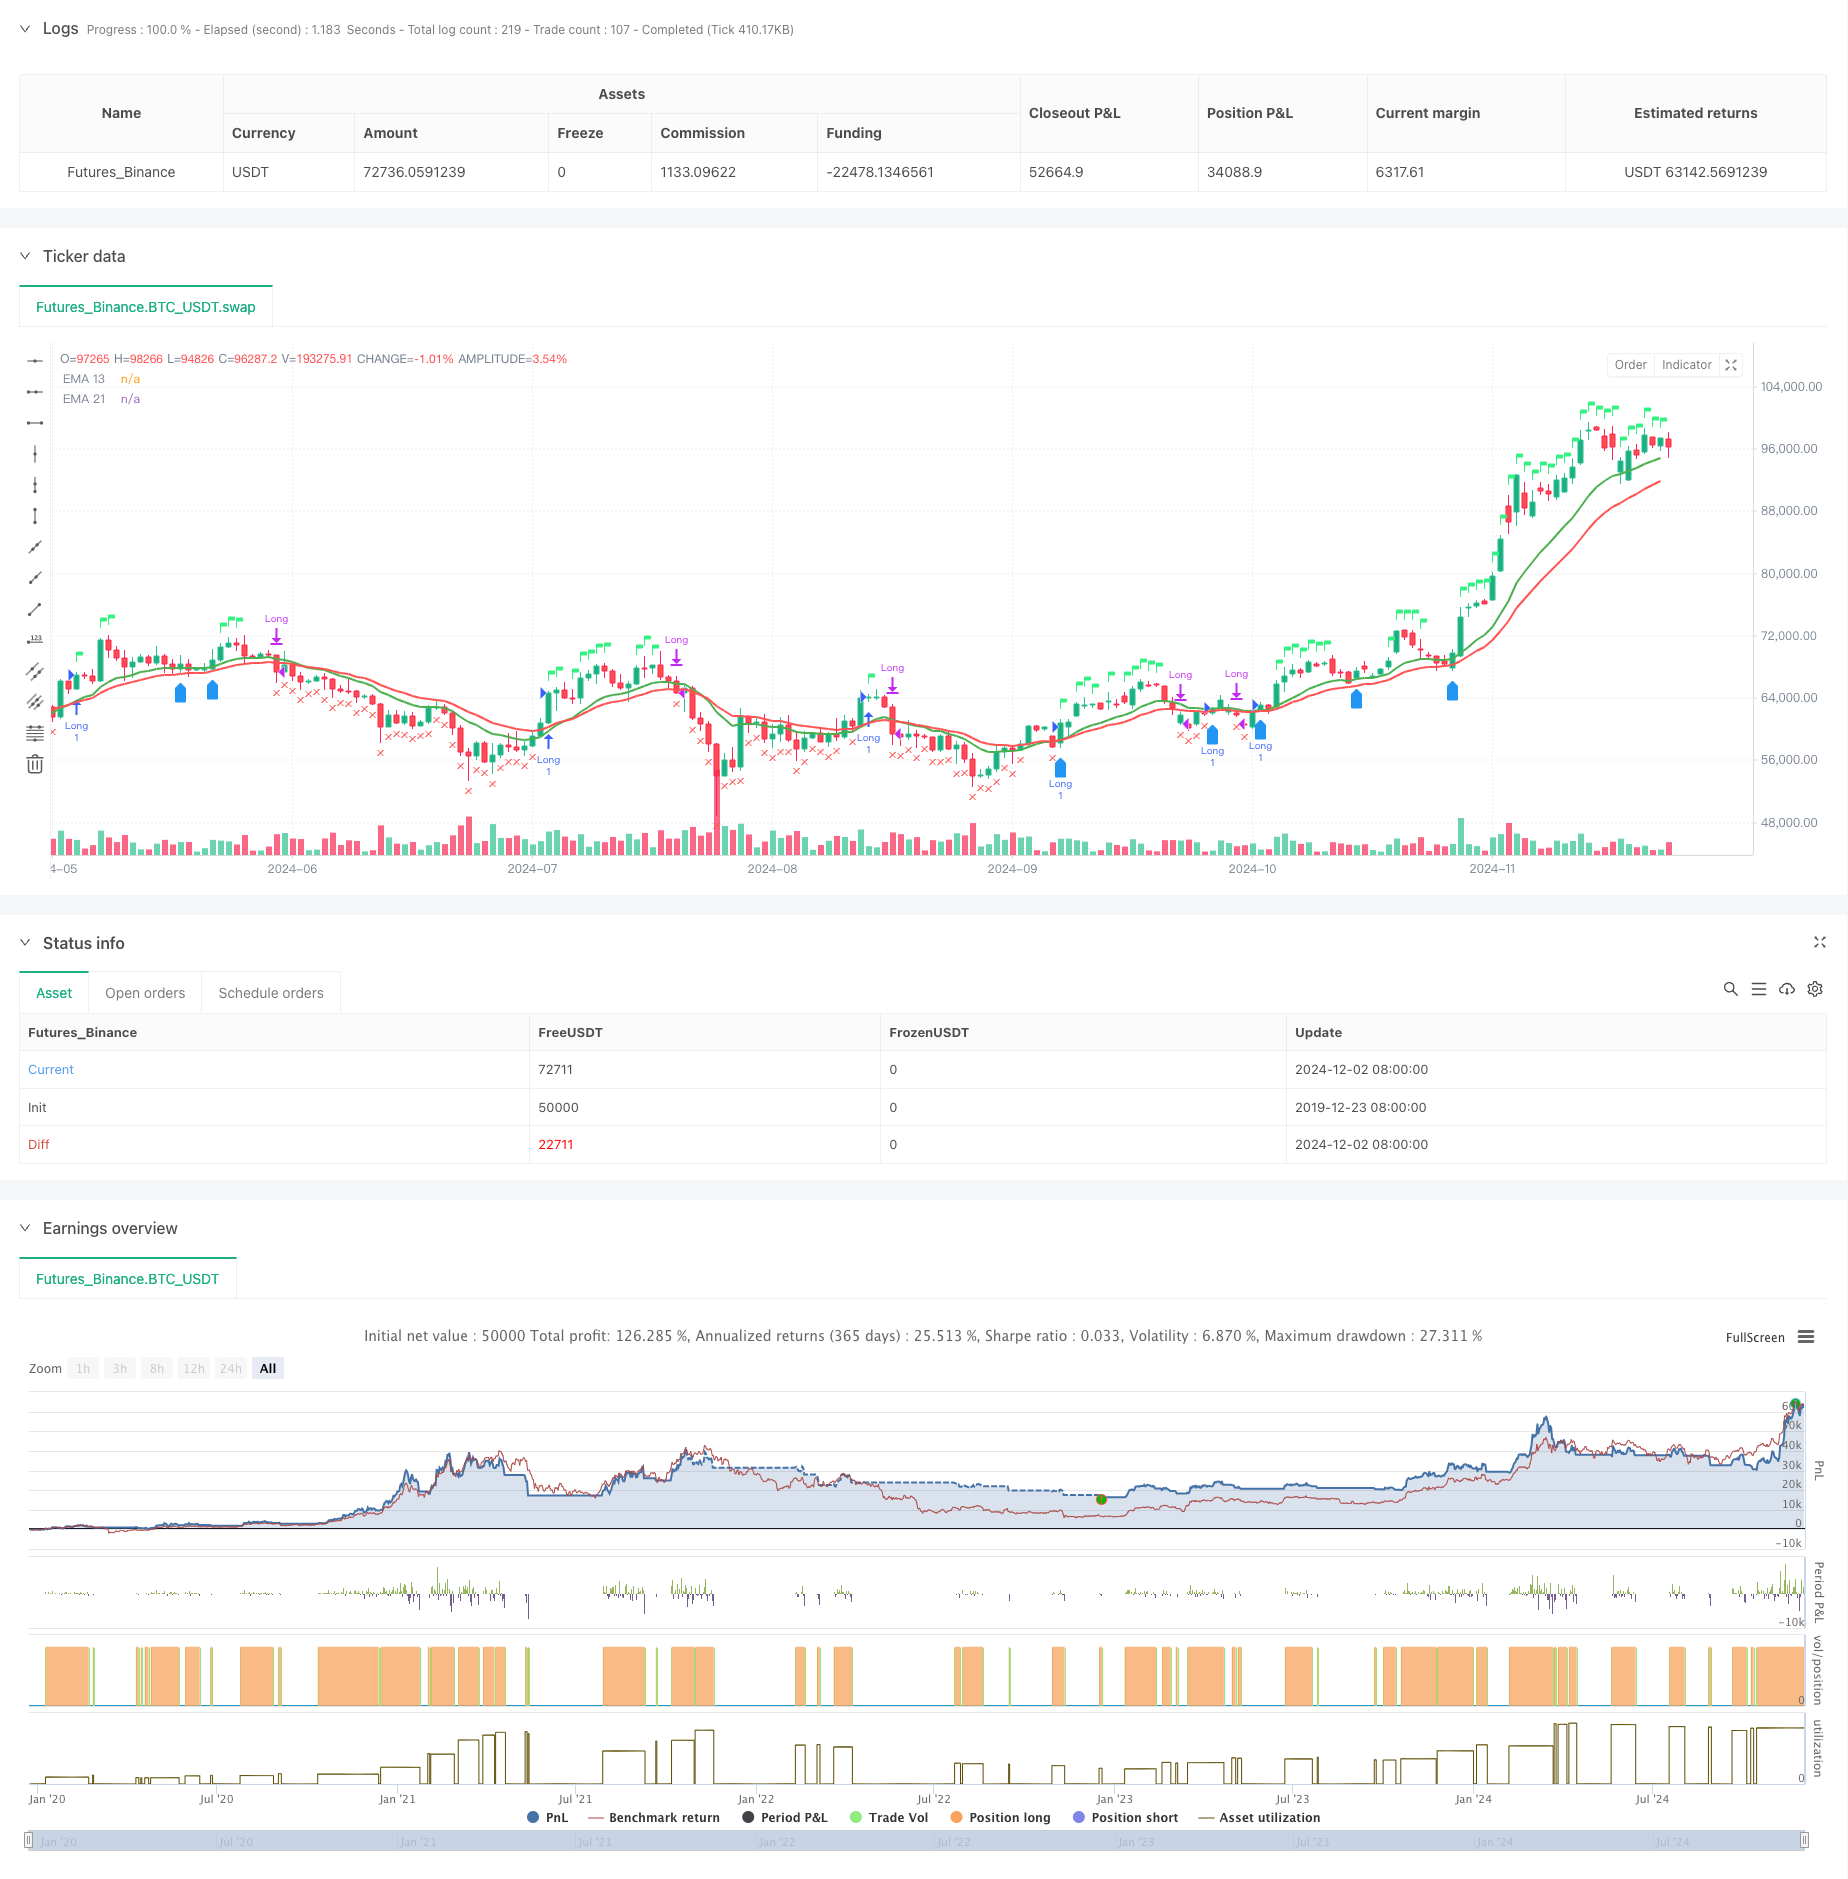
Strategi ini adalah sistem perdagangan komprehensif yang menggabungkan sistem dua garis rata, analisis indikator lemah relatif ((RSI) dan kekuatan relatif ((RS)). Strategi ini mewujudkan mekanisme keputusan perdagangan pelbagai dimensi dengan pengesahan trend di atas rata-rata bergerak indeks pada 13 dan 21 hari ((EMA) dan pengesahan isyarat perdagangan di atas RSI dan nilai RS terhadap indeks asas. Strategi ini juga merangkumi mekanisme kawalan risiko dan penghakiman masuk semula berdasarkan 52 minggu tertinggi.
Prinsip Strategi
Strategi menggunakan mekanisme pengesahan pelbagai isyarat:
- Isyarat masuk mesti memenuhi syarat berikut:
- EMA13 memakai EMA21 atau harga lebih tinggi daripada EMA13
- RSI lebih besar daripada 60
- Kekuatan relatif ((RS) sebagai nilai positif
- Syarat keluar termasuk:
- Harga jatuh ke bawah EMA21
- RSI kurang daripada 50
- RS bertukar kepada negatif
- Syarat kemasukan semula:
- Harga memakai EMA13 dan EMA13 lebih besar daripada EMA21
- RS kekal negatif
- Atau harga melepasi paras tertinggi minggu lalu
Kelebihan Strategik
- Mekanisme pengesahan pelbagai isyarat mengurangkan risiko penembusan palsu
- Analisis kekuatan relatif untuk memilih varieti yang kuat
- Mekanisme penyesuaian kitaran masa yang beradaptasi
- Sistem kawalan risiko yang baik
- Mekanisme kemasukan semula pintar
- Memperlihatkan status dagangan dalam masa nyata
Risiko Strategik
- Pasaran yang bergolak mungkin menyebabkan dagangan yang kerap
- Bergantung kepada pelbagai petunjuk boleh menyebabkan lag isyarat
- Had RSI tetap mungkin tidak sesuai untuk semua keadaan pasaran
- Pengiraan intensiti relatif bergantung kepada ketepatan indeks penanda aras
- Hentian kerugian tertinggi 52 minggu mungkin terlalu longgar
Arah pengoptimuman strategi
- Masukkan RSI yang disesuaikan
- Logik penilaian untuk mengoptimumkan syarat kemasukan semula
- Menambah dimensi analisis jumlah urus niaga
- Meningkatkan mekanisme henti untung dan henti rugi
- Menambah penapis kadar turun naik
- Mengoptimumkan kitaran pengiraan intensiti relatif
ringkaskan
Strategi ini membina sistem perdagangan yang komprehensif dengan menggabungkan analisis teknikal dan analisis kekuatan relatif. Mekanisme pengesahan isyarat berbilang dan sistem kawalan risiko menjadikannya sangat praktikal. Dengan arah pengoptimuman yang disyorkan, strategi ini masih mempunyai ruang untuk peningkatan lebih lanjut. Pelaksanaan strategi yang berjaya memerlukan pedagang mempunyai pemahaman yang mendalam tentang pasaran dan melakukan penyesuaian parameter yang sesuai mengikut ciri-ciri jenis perdagangan tertentu.
/*backtest
start: 2019-12-23 08:00:00
end: 2024-12-03 00:00:00
period: 1d
basePeriod: 1d
exchanges: [{"eid":"Futures_Binance","currency":"BTC_USDT"}]
*/

//@version=5
strategy("EMA 13 & 21 Entry Exit", overlay=true)

// Define the EMAs
ema13 = ta.ema(close, 13)
ema21 = ta.ema(close, 21)

// Define the RSI
rsi = ta.rsi(close, 14)

// Calculate the closing price relative to Nifty 50
//nifty50 = request.security("NSE:NIFTY", timeframe.period, close)
//closeRelative = close / nifty50

// Define a base period (e.g., 123) and adjust it based on the timeframe
//basePeriod = 123

// Calculate the effective period based on the timeframe
//effectivePeriod = basePeriod * (timeframe.isintraday ? (60 / timeframe.multiplier) : 1)

// Calculate the EMA
//rs = ta.ema(closeRelative, effectivePeriod)

// Define the Relative Strength with respect to NIFTY 50
nifty50 = request.security("swap", "D", close)
rs = ta.ema(close / nifty50, 55 )

// Define the previous 2-week low and last week's high
twoWeekLow = ta.lowest(low, 10)  // 10 trading days roughly equal to 2 weeks
lastWeekHigh = ta.highest(high, 5)  // 5 trading days roughly equal to 1 week
fiftytwoWeekhigh = ta.highest(high, 52*5) // 252 tradingdays roughly equal to 52 week.

// Long condition: EMA 21 crossing above EMA 55, price above EMA 21, RSI > 50, and RS > 0
longCondition = ta.crossover(ema13, ema21) or close > ema13 and rsi > 60 and rs > 0

// Exit condition: Price closing below EMA 55 or below the previous 2-week low
exitCondition = close < ema21 or rsi < 50 or rs < 0 //or close < fiftytwoWeekhigh*0.80

// Re-entry condition: Price crossing above EMA 21 after an exit, EMA 21 > EMA 55, and RS > 1
reEntryCondition = ta.crossover(close, ema13) and ema13 > ema21 and rs > 0

// Re-entry condition if trailing stop loss is hit: Price crossing above last week's high
reEntryAfterSL = ta.crossover(close, lastWeekHigh)

// Plot the EMAs
plot(ema13 ,color=color.green, title="EMA 13",linewidth = 2)
plot(ema21, color=color.red, title="EMA 21",linewidth = 2)


// Plot buy and sell signals
plotshape(series=longCondition, location=location.abovebar, color=color.rgb(50, 243, 130), style=shape.flag, title="Buy Signal")
plotshape(series=exitCondition, location=location.belowbar, color=color.red, style=shape.xcross, title="Sell Signal")
plotshape(series=reEntryCondition or reEntryAfterSL, location=location.belowbar, color=color.blue, style=shape.labelup, title="Re-entry Signal")
//plotshape(series = fiftytwoWeekhigh,location=location.abovebar, color=color.blue,style=shape.flag, title="52WH")

// Plot background color for RS > 0
//bgcolor(rs > 0 ? color.new(color.green, 90) : na, title="RS Positive Background")
// Plot the previous 2-week low and last week's high
// plot(twoWeekLow, color=color.orange, title="2-Week Low")
// plot(lastWeekHigh, color=color.purple, title="Last Week High")

// Strategy logic
if (longCondition or reEntryCondition or reEntryAfterSL)
    strategy.entry("Long", strategy.long)

if (exitCondition)
    strategy.close("Long")

 // Calculate Stop Loss (SL) and Profit
var float entryPrice = na
var float stopLoss = na
var float profit = na

if (strategy.opentrades > 0)
    entryPrice := strategy.opentrades.entry_price(strategy.opentrades - 1)
    stopLoss := fiftytwoWeekhigh * 0.80
    profit := (close - entryPrice) / entryPrice * 100

// Display the strategy table
var table strategyTable = table.new(position.top_right, 4, 2, border_width = 1)

// Make the table movable
tableX = input.int(0, title="Table X Position")
tableY = input.int(0, title="Table Y Position")

// Add size options for the table
tableSize = input.string("small", title="Table Size", options=["tiny", "small", "large"])

// Adjust table size based on user input
tableWidth = tableSize == "tiny" ? 2 : tableSize == "small" ? 4 : 6
tableHeight = tableSize == "tiny" ? 1 : tableSize == "small" ? 2 : 3

// Create the table with the specified size
//table = table.new(position.top_right, tableWidth, tableHeight, border_width = 1)

// Position the table based on user input
// table.cell(strategyTable, tableX, tableY, "Entry Price",  bgcolor=#18eef9)
// table.cell(strategyTable, tableX, tableY + 1, str.tostring(entryPrice, format.mintick), bgcolor=#18eef9)
// table.cell(strategyTable, tableX + 1, tableY, "Stop Loss (20%)", bgcolor=color.red)
// table.cell(strategyTable, tableX + 1, tableY + 1, str.tostring(stopLoss, format.mintick), bgcolor=color.red)
// table.cell(strategyTable, tableX + 2, tableY, "Profit (%)", bgcolor=color.green)
// table.cell(strategyTable, tableX + 2, tableY + 1, str.tostring(profit, format.percent), bgcolor=color.green)