Strategi Kuantitatif Persilangan Momentum Trend Berbilang Penunjuk

Gambaran keseluruhan
Ini adalah strategi perdagangan pelbagai indikator yang menggabungkan Supertrend, Indeks Moving Average (EMA) dan Indeks Relatif Lemah (RSI). Strategi ini menggunakan tiga indikator teknikal untuk mengenal pasti trend pasaran, momentum dan potensi titik balik untuk mencari peluang perdagangan yang ideal di pasaran. Strategi ini memanfaatkan kelebihan pelbagai indikator untuk meningkatkan ketepatan dan kebolehpercayaan perdagangan dengan analisis pasaran yang berbeza dimensi.
Prinsip Strategi
Logik utama strategi ini adalah berdasarkan kepada analisis gabungan tiga petunjuk teknikal utama:
- Penunjuk Supertrend digunakan untuk menentukan arah trend keseluruhan, menggunakan kadar turun naik ATR untuk menyesuaikan garis trend secara dinamik.
- Perpaduan EMA jangka pendek (siklus 9) dan jangka panjang (siklus 21) digunakan untuk menangkap perubahan pergerakan harga.
- RSI digunakan untuk mengenal pasti sama ada pasaran berada dalam keadaan overbought atau oversold.
Sinyal pembelian perlu memenuhi syarat berikut:
- Penunjuk Supertrend menunjukkan trend berlainan arah ((harga berada di atas garis Supertrend)
- EMA jangka pendek naik melalui EMA jangka panjang
- RSI tidak mencapai tahap overbought (<70)
Sinyal jual beli perlu memenuhi syarat berikut:
- Penunjuk Supertrend menunjukkan trend kosong (harga berada di bawah garis Supertrend)
- EMA jangka pendek ke bawah melalui EMA jangka panjang
- RSI tidak mencapai tahap oversold ((di atas 30)
Kelebihan Strategik
- Pengesahan silang pelbagai indikator meningkatkan kebolehpercayaan isyarat
- Menggabungkan kelebihan trend tracking dan analisis momentum
- Menapis isyarat palsu yang berpotensi melalui RSI
- Parameter strategi boleh disesuaikan secara fleksibel mengikut keadaan pasaran yang berbeza
- Peraturan masuk dan keluar yang jelas, mengurangkan kesan penilaian subjektif
- Mempunyai mekanisme kawalan risiko yang baik
Risiko Strategik
- Isyarat palsu yang kerap mungkin berlaku dalam pasaran yang tidak menentu
- Kelemahan dalam pelbagai petunjuk mungkin menyebabkan kelewatan kecil dalam masa masuk dan keluar
- Pemilihan parameter yang tidak betul boleh menjejaskan prestasi strategi
- Perubahan mendadak dalam pasaran mungkin menyebabkan penarikan balik yang lebih besar
- Kesan kos urus niaga ke atas pulangan strategi perlu dipertimbangkan
Arah pengoptimuman strategi
- Memperkenalkan mekanisme parameter penyesuaian untuk melaraskan parameter penunjuk secara dinamik mengikut turun naik pasaran
- Menambah analisis kuantitatif untuk meningkatkan kebolehpercayaan isyarat
- Membangunkan modul pengenalan persekitaran pasaran yang menggunakan kombinasi parameter yang berbeza dalam persekitaran pasaran yang berbeza
- Meningkatkan mekanisme hentian dan penangguhan kerugian, dan mengoptimumkan pengurusan wang
- Pertimbangkan untuk menambah penapis turun naik untuk mengelakkan perdagangan berlebihan dalam persekitaran turun naik yang rendah
ringkaskan
Ini adalah strategi perdagangan kuantitatif berbilang indikator yang lengkap dan logik yang jelas, yang membina sistem perdagangan yang agak menyeluruh dengan menggabungkan trend tracking, analisis momentum dan indikator overbought dan oversold. Keunggulan strategi ini adalah bahawa cross-verifikasi berbilang indikator meningkatkan kebolehpercayaan isyarat, dan mempunyai mekanisme kawalan risiko yang jelas. Walaupun terdapat beberapa risiko yang wujud, dengan pengoptimuman dan penyempurnaan yang berterusan, strategi ini dijangka dapat mengekalkan prestasi yang stabil dalam pelbagai keadaan pasaran.
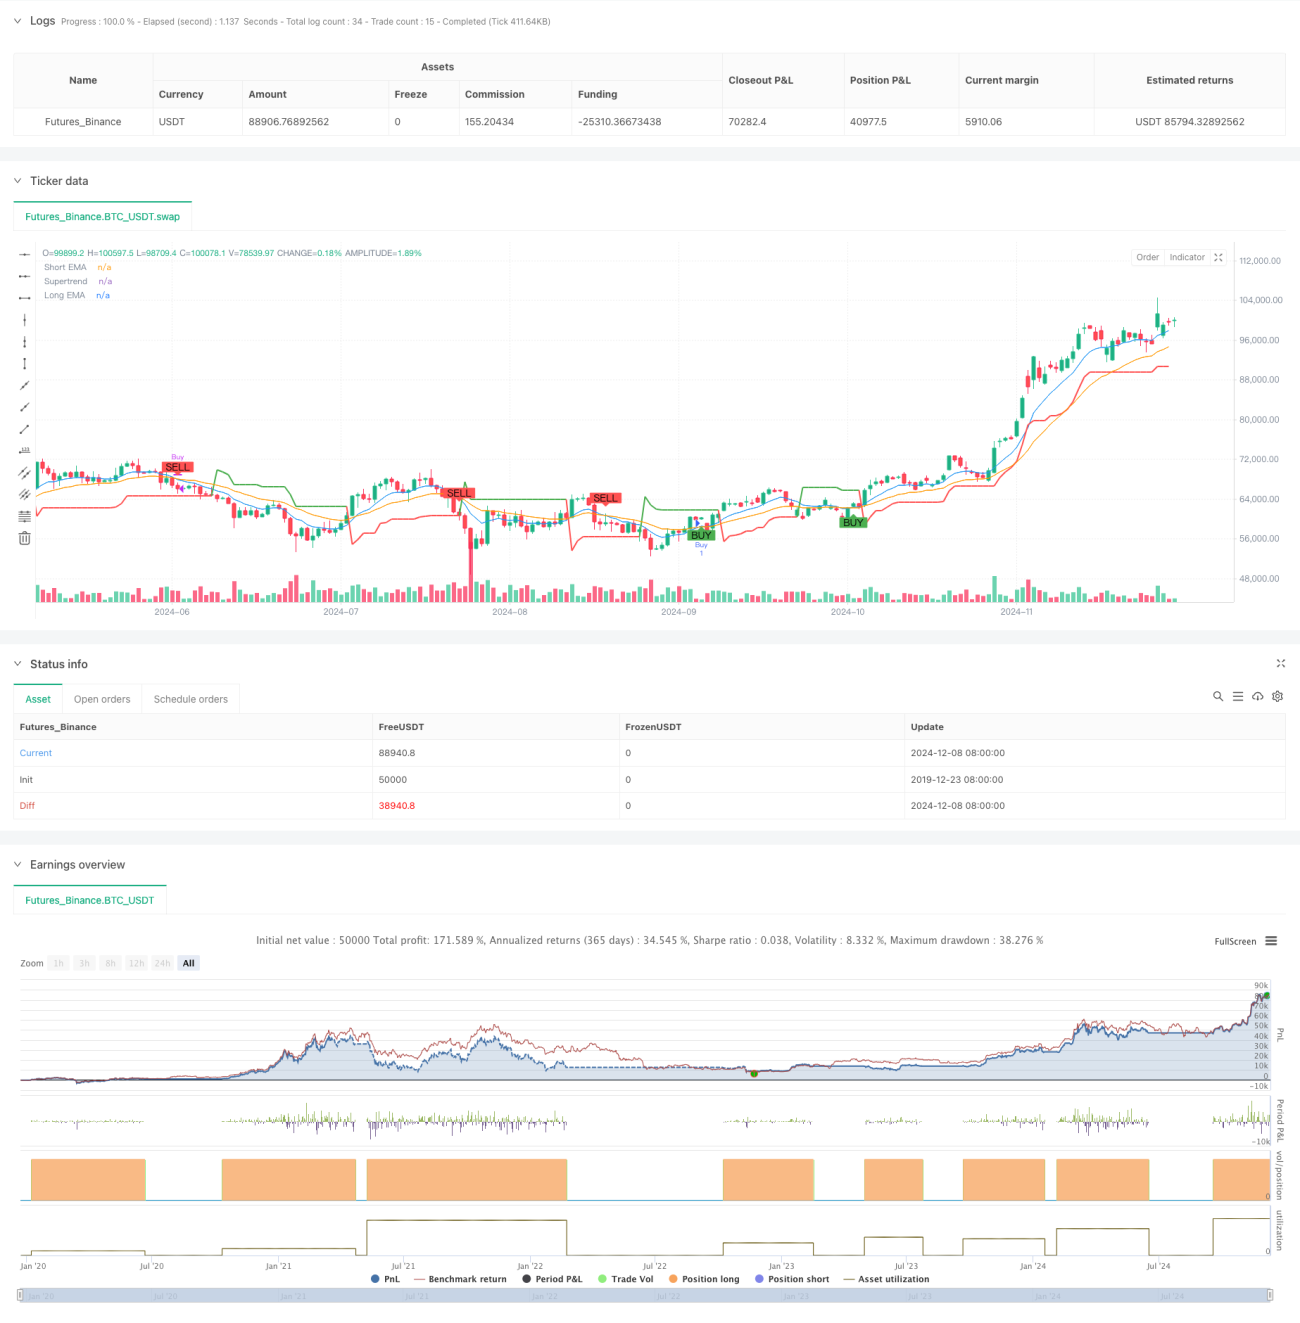
/*backtest
start: 2019-12-23 08:00:00
end: 2024-12-09 08:00:00
period: 1d
basePeriod: 1d
exchanges: [{"eid":"Futures_Binance","currency":"BTC_USDT"}]
*/

// This Pine Script™ code is subject to the terms of the Mozilla Public License 2.0 at https://mozilla.org/MPL/2.0/
// © satyakipaul3744

//@version=6- 1