
Gambaran keseluruhan
Strategi ini adalah sistem perdagangan pintar yang menggabungkan MACD (Moving Average Convergence Spread Indicator) dan LRS (Linear Regression Slope). Strategi ini mengoptimumkan pengiraan indikator MACD melalui kombinasi pelbagai kaedah moving average, dan memperkenalkan analisis regresi linear untuk meningkatkan kebolehpercayaan isyarat perdagangan. Strategi ini membolehkan peniaga mempunyai pilihan yang fleksibel untuk menghasilkan isyarat perdagangan menggunakan satu indikator atau gabungan dua indikator, dan dilengkapi dengan mekanisme stop loss untuk mengawal risiko.
Prinsip Strategi
Di tengah-tengah strategi ini adalah untuk menangkap trend pasaran melalui MACD yang dioptimumkan dan penunjuk pulangan linear. Bahagian MACD menggunakan kombinasi empat kaedah purata bergerak SMA, EMA, WMA dan TEMA untuk meningkatkan kepekaan kepada trend harga. Bahagian pulangan linear untuk menilai arah dan kekuatan trend dengan mengira kemiringan dan kedudukan garis pulangan.
Kelebihan Strategik
- Fleksibiliti dalam kombinasi: anda boleh memilih untuk menggunakan satu atau dua kombinasi mengikut keadaan pasaran
- Pengiraan MACD yang lebih baik: meningkatkan ketepatan pengenalan trend melalui pelbagai kaedah purata bergerak
- Pengesahan trend objektif: penghakiman trend yang disokong oleh statistik matematik menggunakan regresi linear
- Pengurusan risiko yang lebih baik: Sistem Stop Loss Bersepadu
- Parameter yang boleh disesuaikan: parameter utama boleh dioptimumkan mengikut ciri-ciri pasaran yang berbeza
Risiko Strategik
- Sensitiviti parameter: mungkin memerlukan penyesuaian parameter yang kerap dalam keadaan pasaran yang berbeza
- Penangguhan isyarat: Indikator purata bergerak mempunyai keterlambatan tertentu
- Tidak berlaku untuk pasaran goyah: mungkin menghasilkan isyarat palsu dalam pasaran goyah mendatar
- Kos peluang dari pengesahan berganda: pengesahan berganda yang ketat mungkin kehilangan peluang perdagangan yang baik
Arah pengoptimuman strategi
- Peningkatan pengiktirafan keadaan pasaran: pengenalan penunjuk kadar turun naik untuk membezakan pasaran yang sedang tren dan bergolak
- Penyesuaian parameter dinamik: parameter yang menyesuaikan MACD dan regresi linear secara automatik mengikut keadaan pasaran
- Mengoptimumkan Stop Loss: memperkenalkan Stop Loss Dinamik, menyesuaikan secara automatik mengikut turun naik pasaran
- Peningkatan analisis jumlah transaksi: Gabungan penunjuk jumlah transaksi untuk meningkatkan kredibiliti isyarat
- Pengenalan analisis kitaran masa: pertimbangkan pengesahan kitaran masa berbilang untuk meningkatkan ketepatan urus niaga
ringkaskan
Strategi ini menggabungkan versi penambahbaikan dan kaedah statistik penunjuk klasik untuk mewujudkan sistem perdagangan yang fleksibel dan boleh dipercayai. Reka bentuk modularnya membolehkan peniaga menyesuaikan parameter strategi dan mekanisme pengesahan isyarat secara fleksibel mengikut keadaan pasaran yang berbeza. Dengan pengoptimuman dan penambahbaikan berterusan, strategi ini dijangka mengekalkan prestasi yang stabil dalam pelbagai keadaan pasaran.
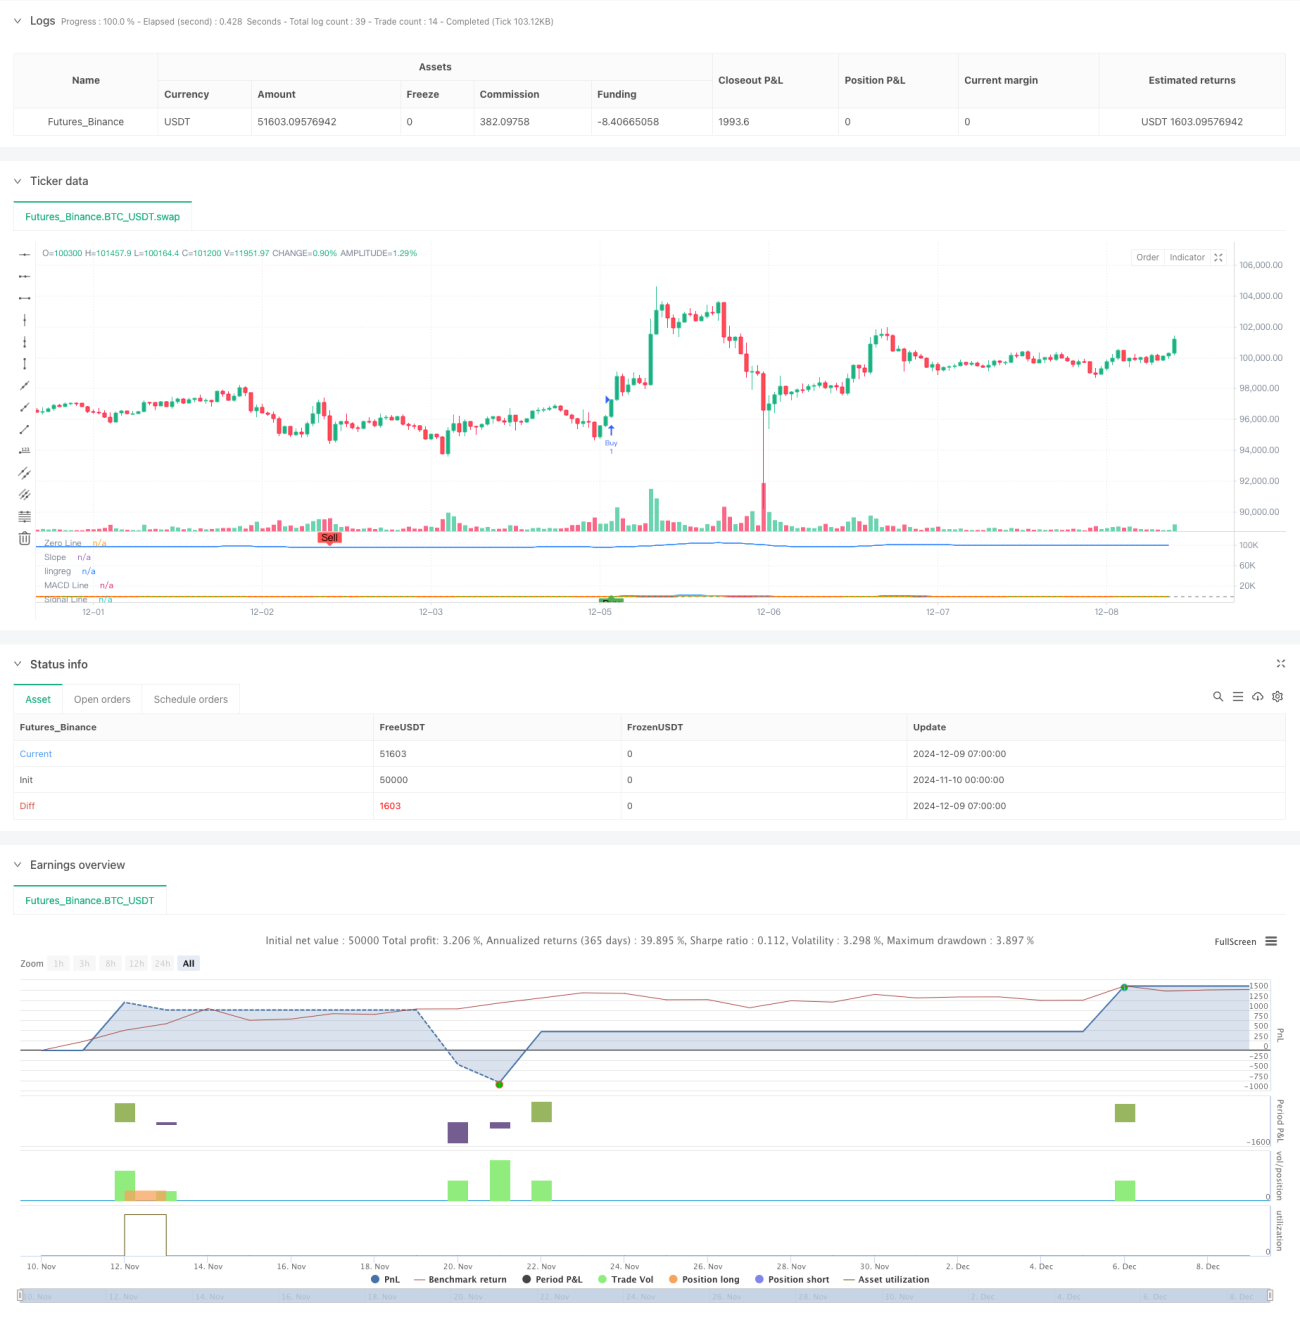
/*backtest
start: 2024-11-10 00:00:00
end: 2024-12-09 08:00:00
period: 1h
basePeriod: 1h
exchanges: [{"eid":"Futures_Binance","currency":"BTC_USDT"}]
*/

//@version=6
strategy('SIMPLIFIED MACD & LRS Backtest by NHBProd', overlay=false)

// Function to calculate TEMA (Triple Exponential Moving Average)- 1