
Gambaran keseluruhan
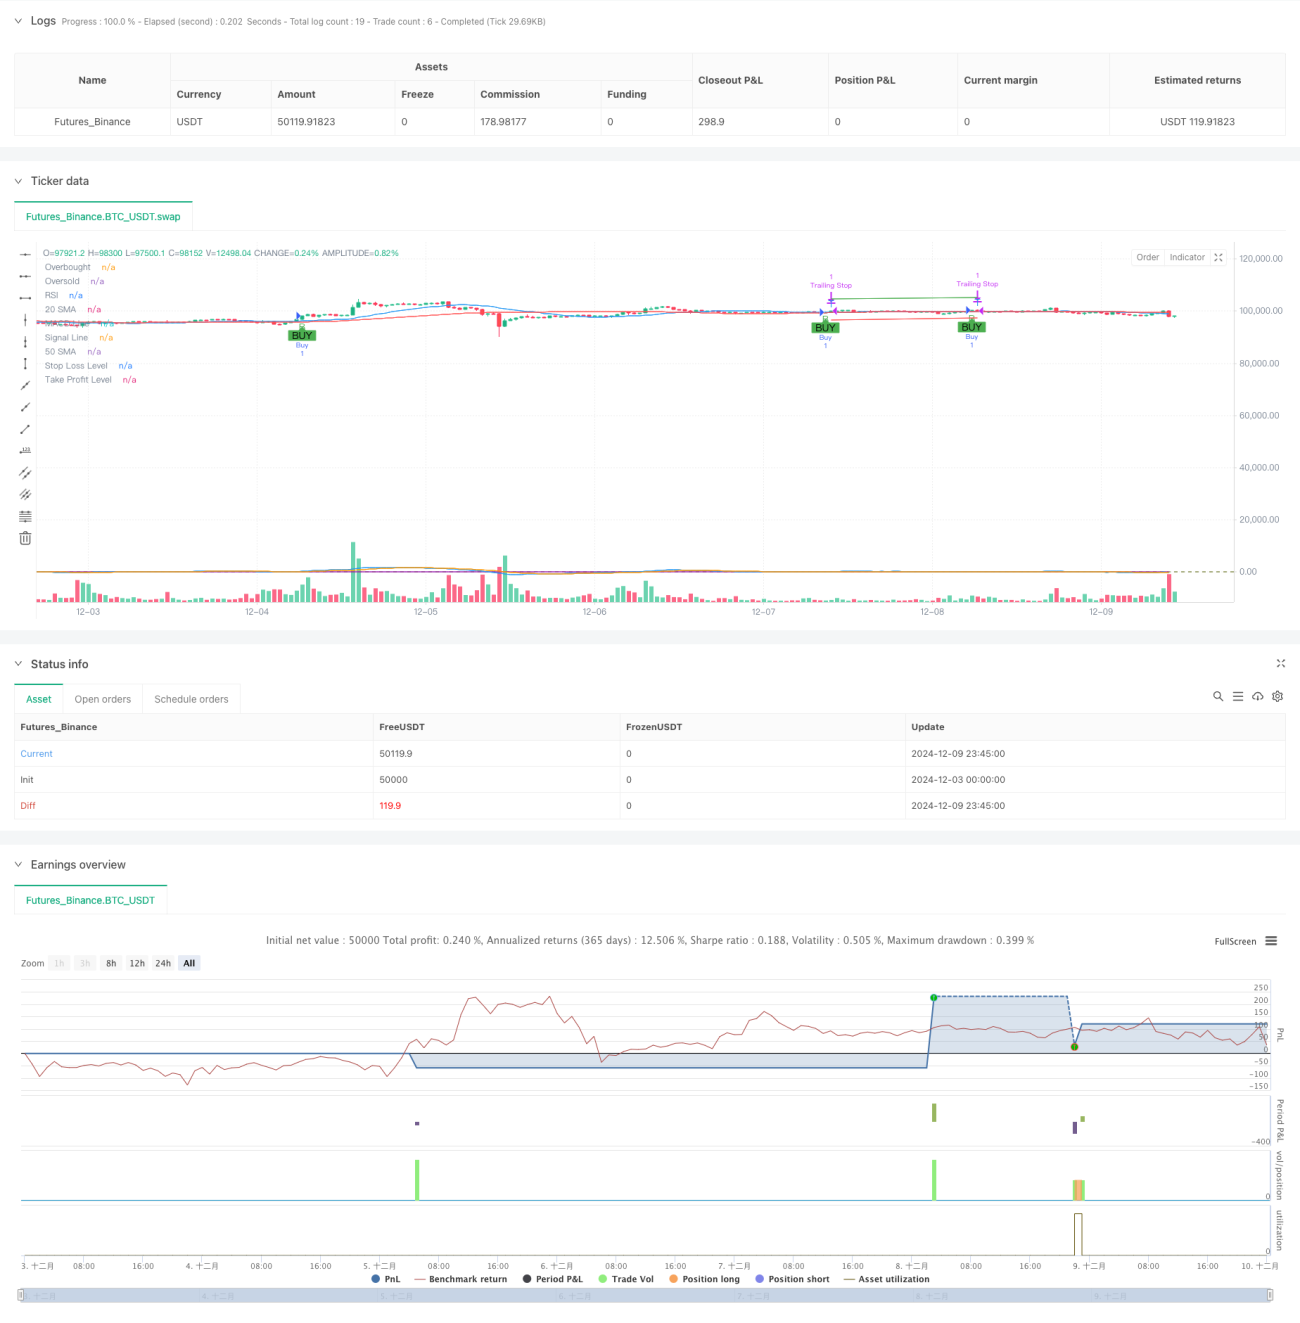
Strategi ini adalah sistem perdagangan trend-tracking yang menggabungkan pelbagai petunjuk teknikal. Ia melakukan perdagangan apabila trend pasaran jelas dengan menggabungkan RSI, MACD, dan SMA. Strategi ini juga merangkumi mekanisme pengurusan risiko seperti stop loss, stop loss, dan tracking stop loss untuk pengurusan wang yang lebih baik.
Prinsip Strategi
Strategi ini berpusat pada beberapa syarat utama:
- Penunjuk MACD muncul garpu emas ((membentangkan garis isyarat pada garis MACD)
- RSI di bawah 70, mengelakkan kawasan overbought
- Harga terletak di atas garis purata jangka pendek (rata-rata 20 hari)
- Garis purata jangka pendek terletak di atas garis purata jangka panjang ((50 hari garis purata)
Apabila syarat-syarat di atas dipenuhi secara serentak, sistem akan mengeluarkan beberapa isyarat. Pada masa yang sama, strategi menetapkan sasaran 5% untuk berhenti, 3% untuk menghentikan kerugian, dan 2% untuk mengesan kerugian untuk melindungi keuntungan yang diperoleh. Reka bentuk syarat perdagangan bertingkat ini membantu meningkatkan ketepatan dan keselamatan perdagangan.
Kelebihan Strategik
- Penggunaan bersepadu pelbagai petunjuk teknikal meningkatkan kebolehpercayaan isyarat perdagangan
- Saringan RSI untuk mengelakkan kawasan overbought dan masuk pada kedudukan tinggi
- Penggunaan sistem garis rata membantu mengesahkan trend jangka panjang
- mekanisme pengurusan risiko yang baik, termasuk penutupan tetap dan penutupan yang dikesan
- Parameter strategi boleh disesuaikan secara fleksibel untuk menyesuaikan diri dengan keadaan pasaran yang berbeza
- Julat masa dagangan boleh disesuaikan untuk memudahkan pengesanan dan aplikasi dalam talian
Risiko Strategik
- Penunjuk ganda boleh menyebabkan kelewatan isyarat dan menjejaskan masa masuk
- Isyarat palsu mungkin berlaku dalam pasaran yang tidak menentu
- Nisbah Stop Loss Tetap mungkin tidak sesuai untuk semua keadaan pasaran
- Tracking stop loss mungkin keluar dari kedudukan menguntungkan terlalu awal apabila pasaran bergolak
Langkah-langkah penanggulangan termasuk: menyesuaikan parameter indikator dengan sewajarnya, menyesuaikan nisbah stop loss mengikut ciri-ciri pasaran yang berbeza, menambah penapis persekitaran pasaran, dan sebagainya.
Arah pengoptimuman strategi
- Pengenalan penunjuk kadar turun naik (seperti ATR) untuk menjadikan stop loss lebih fleksibel
- Peningkatan keberkesanan isyarat pengesahan penunjuk kuantiti transaksi
- Menambah mekanisme penilaian keadaan pasaran, menggunakan parameter yang berbeza dalam keadaan pasaran yang berbeza
- Optimumkan parameter MACD untuk meningkatkan kesesuaian isyarat
- Pertimbangkan untuk menambah isyarat pembalikan, untuk mewujudkan fungsi pengudaraan
Langkah-langkah pengoptimuman ini dapat meningkatkan fleksibiliti dan kestabilan strategi.
ringkaskan
Strategi ini membina sistem perdagangan yang agak sempurna dengan penggunaan gabungan pelbagai petunjuk teknikal. Ia tidak hanya mengandungi logik teras untuk mengikuti trend, tetapi juga mempertimbangkan pengurusan risiko. Walaupun terdapat beberapa tempat yang perlu dioptimumkan, kerangka keseluruhan mempunyai skalabiliti dan kesesuaian yang baik.
- 1