Strategi berikut trend berbilang penunjuk digabungkan dengan saluran dinamik dan sistem perdagangan purata bergerak

1
Follow
1785
Followers
Gambaran keseluruhan
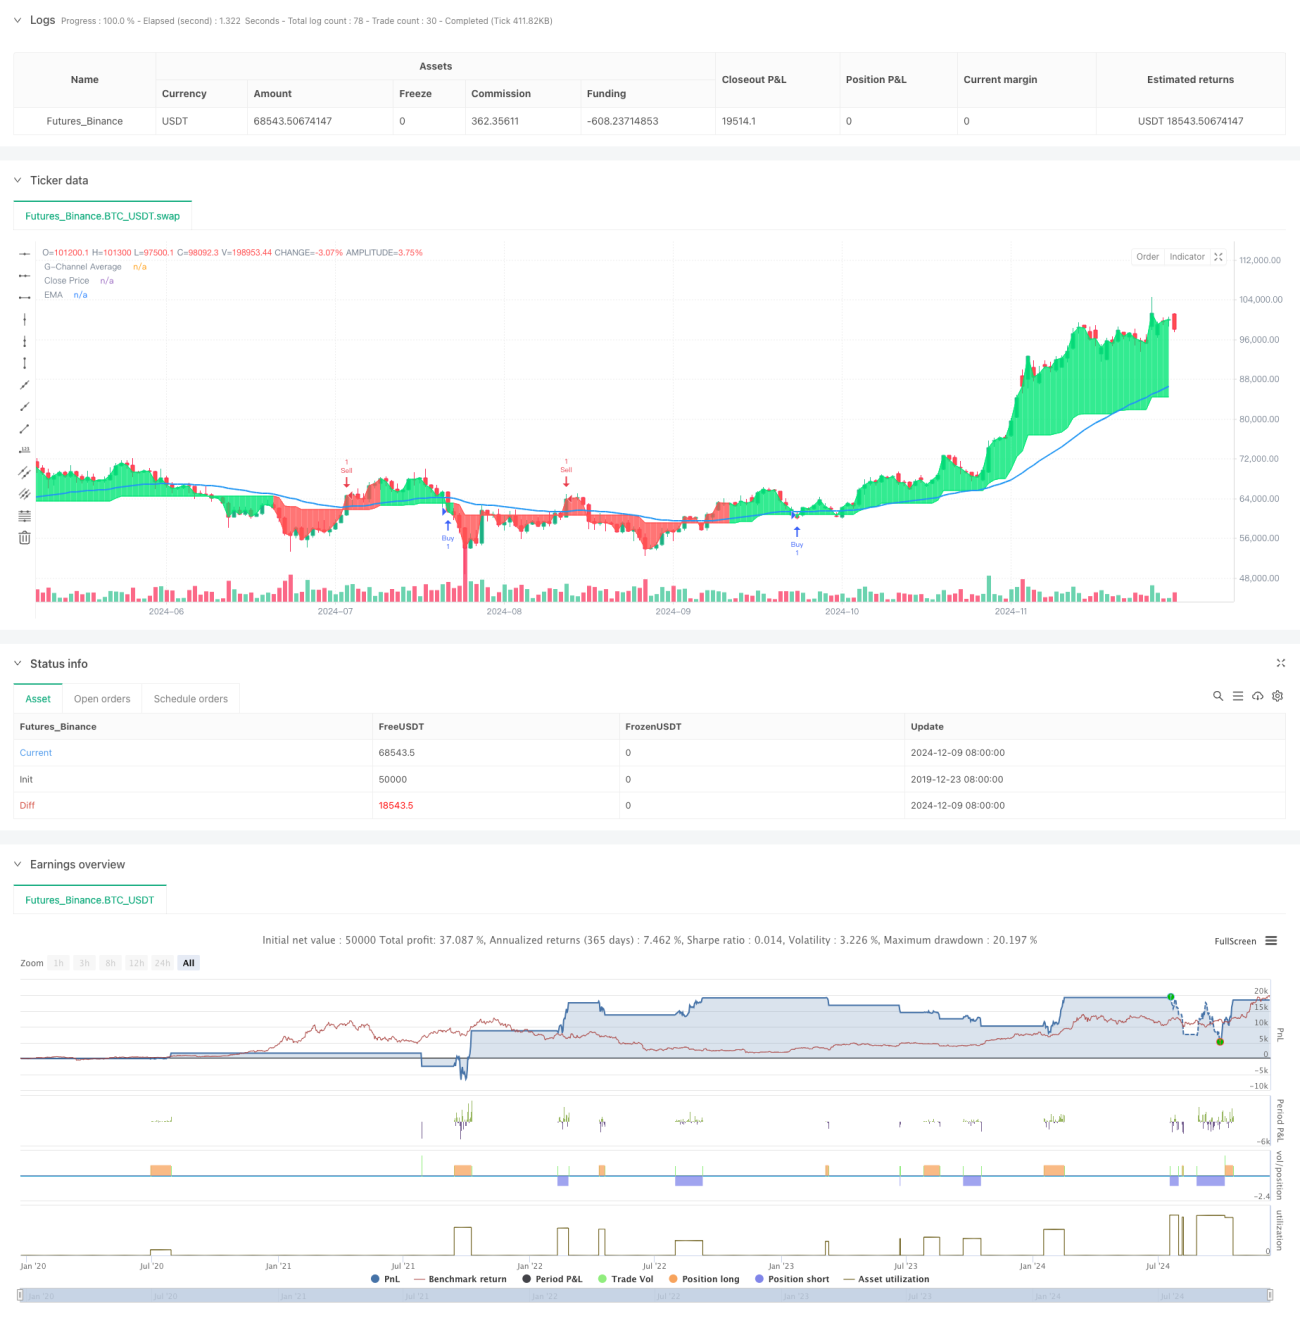
Strategi ini adalah sistem perdagangan multi-indikator yang menggabungkan saluran G, purata bergerak indeks, EMA, dan amplitudo turun naik sebenar, ATR. Ia mengenal pasti isyarat perdagangan melalui sokongan / rintangan dinamik dan pengesahan trend, dan menguruskan risiko menggunakan berhenti dan berhenti berasaskan ATR.
Prinsip Strategi
Logik utama strategi ini adalah berdasarkan beberapa komponen utama:
- G saluran mengira tahap sokongan dan rintangan dinamik, terus menyesuaikan naik dan turun melalui formula matematik
- EMA digunakan untuk mengenal pasti arah trend keseluruhan, harga dan kedudukan relatif EMA menentukan arah perdagangan
- Isyarat masuk berdasarkan penembusan saluran G dan pengesahan kedudukan EMA
- Tetapkan stop loss dan stop loss dengan ATR ganda, stop loss 2 kali ATR, dan stop loss 4 kali ATR
- Mengelakkan pengulangan berturut-turut melalui pengesanan status
Kelebihan Strategik
- Mekanisme pengesahan isyarat bertingkat meningkatkan kebolehpercayaan transaksi
- Had laluan yang disesuaikan secara dinamik untuk menyesuaikan diri dengan keadaan pasaran yang berbeza
- Pengurusan risiko berdasarkan kadar turun naik adalah lebih fleksibel
- Mengelakkan isyarat berulang mengurangkan risiko perdagangan berlebihan
- Tanda jual beli yang jelas untuk analisis dan pengesanan
Risiko Strategik
- Mungkin terlalu banyak isyarat palsu di pasaran Forex
- EMA sebagai penunjuk ketinggalan yang boleh menyebabkan kelewatan masa masuk
- Penutupan ATR dengan kelipatan tetap mungkin tidak fleksibel dalam tempoh turun naik yang tinggi
- Memperolehi data sejarah yang lebih panjang untuk mengira pelbagai petunjuk
- Pengoptimuman parameter boleh menyebabkan pemasangan berlebihan
Arah pengoptimuman strategi
- Memperkenalkan isyarat pengesahan lalu lintas untuk meningkatkan kebolehpercayaan penembusan
- Mengubah ATR secara dinamik untuk menyesuaikan diri dengan keadaan pasaran yang berbeza
- Menambah penapis persekitaran pasaran untuk mengelakkan dagangan di bawah keadaan yang tidak baik
- Logik penapisan isyarat yang dioptimumkan untuk mengurangkan isyarat palsu
- Pertimbangkan untuk menyertai sistem pengurusan kedudukan yang dinamik
ringkaskan
Strategi ini membina sistem perdagangan yang lengkap dengan menggabungkan beberapa petunjuk teknikal yang matang. Kelebihan sistem adalah mekanisme pengesahan isyarat bertingkat dan pengurusan risiko berdasarkan kadar turun naik, tetapi masih perlu dioptimumkan mengikut ciri-ciri pasaran tertentu dalam aplikasi sebenar.
Source
Pine
Strategy parameters
Related strategies
Comment
All comments (0)
No data
- 1