
Strategi ini adalah sistem pengesanan trend yang menyesuaikan diri yang menggabungkan beberapa petunjuk teknikal. Ia mengoptimumkan prestasi perdagangan melalui analisis pelbagai kitaran dan penyesuaian stop loss secara dinamik. Inti strategi ini adalah untuk menggunakan sistem identifikasi trend, mengesahkan kekuatan trend melalui RSI dan MACD, dan menyesuaikan parameter pengurusan risiko berdasarkan ATR secara dinamik.
Strategi ini menggunakan mekanisme triple-verify untuk berdagang: 1) arah trend dinilai oleh EMA yang bercampur-campur dalam jangka masa yang cepat dan perlahan; 2) menggunakan RSI untuk menapis isyarat perdagangan dengan pengesahan pembelian dan penjualan dan pengesahan tren MACD; 3) memperkenalkan pengesahan tren EMA dalam jangka masa yang lebih tinggi. Dari segi kawalan risiko, strategi ini menyesuaikan sasaran berhenti dan keuntungan mengikut ATR secara dinamik, mewujudkan pengurusan kedudukan yang menyesuaikan diri.
Ini adalah sistem pengesanan trend yang dirancang dengan teliti, yang menyediakan penyelesaian perdagangan yang komprehensif melalui mekanisme pengesahan bertingkat dan pengurusan risiko dinamik. Kelebihan utama strategi adalah kemampuan menyesuaikan diri dan mengawal risiko, tetapi perlu berhati-hati dalam pengoptimuman parameter dan penyesuaian dengan keadaan pasaran. Dengan pengoptimuman dan penyempurnaan berterusan, strategi ini dijangka dapat mengekalkan prestasi yang stabil dalam pelbagai keadaan pasaran.
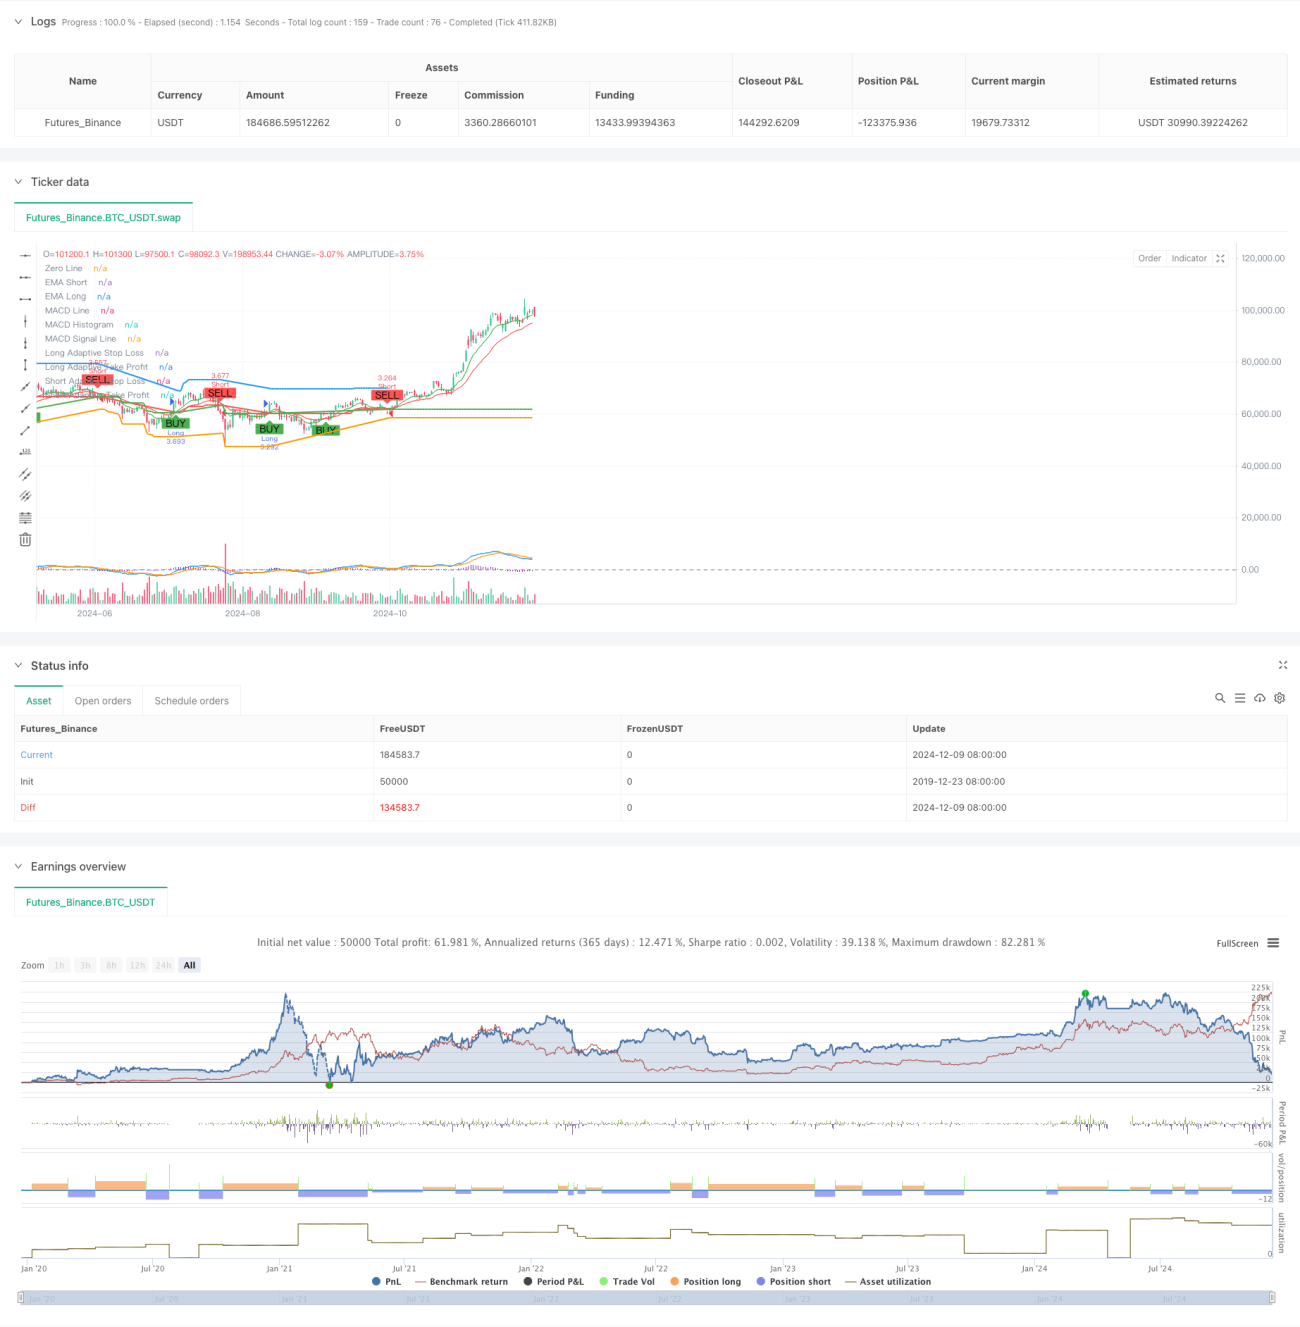
/*backtest
start: 2019-12-23 08:00:00
end: 2024-12-10 08:00:00
period: 1d
basePeriod: 1d
exchanges: [{"eid":"Futures_Binance","currency":"BTC_USDT"}]
*/
//@version=5
strategy("TrenGuard Adaptive ATR Strategy", overlay=true, default_qty_type=strategy.percent_of_equity, default_qty_value=100)
// Parameters
emaShortPeriod = input.int(9, title="Short EMA Period", minval=1)
emaLongPeriod = input.int(21, title="Long EMA Period", minval=1)
rsiPeriod = input.int(14, title="RSI Period", minval=1)
rsiOverbought = input.int(70, title="RSI Overbought", minval=50)
rsiOversold = input.int(30, title="RSI Oversold", minval=1)
atrPeriod = input.int(14, title="ATR Period", minval=1)
atrMultiplierSL = input.float(2.0, title="ATR Multiplier for Stop-Loss", minval=0.1)
atrMultiplierTP = input.float(2.0, title="ATR Multiplier for Take-Profit", minval=0.1)
// Multi-timeframe settings
htfEMAEnabled = input.bool(true, title="Use Higher Timeframe EMA Confirmation?", inline="htf")
htfEMATimeframe = input.timeframe("D", title="Higher Timeframe", inline="htf")
// MACD Parameters
macdShortPeriod = input.int(12, title="MACD Short Period", minval=1)
macdLongPeriod = input.int(26, title="MACD Long Period", minval=1)
macdSignalPeriod = input.int(9, title="MACD Signal Period", minval=1)
// Select trade direction
tradeDirection = input.string("Both", title="Trade Direction", options=["Both", "Long", "Short"])
// Calculating indicators
emaShort = ta.ema(close, emaShortPeriod)
emaLong = ta.ema(close, emaLongPeriod)
rsiValue = ta.rsi(close, rsiPeriod)
atrValue = ta.atr(atrPeriod)
[macdLine, macdSignalLine, _] = ta.macd(close, macdShortPeriod, macdLongPeriod, macdSignalPeriod)
// Higher timeframe EMA confirmation
htfEMALong = request.security(syminfo.tickerid, htfEMATimeframe, ta.ema(close, emaLongPeriod))
// Trading conditions
longCondition = ta.crossover(emaShort, emaLong) and rsiValue < rsiOverbought and (not htfEMAEnabled or close > htfEMALong) and macdLine > macdSignalLine
shortCondition = ta.crossunder(emaShort, emaLong) and rsiValue > rsiOversold and (not htfEMAEnabled or close < htfEMALong) and macdLine < macdSignalLine
// Initial Stop-Loss and Take-Profit levels based on ATR
var float adaptiveStopLoss = na
var float adaptiveTakeProfit = na
if (strategy.position_size > 0) // Long Position
if (longCondition) // Trend Confirmation
adaptiveStopLoss := na(adaptiveStopLoss) ? close - atrValue * atrMultiplierSL : math.max(adaptiveStopLoss, close - atrValue * atrMultiplierSL)
adaptiveTakeProfit := na(adaptiveTakeProfit) ? close + atrValue * atrMultiplierTP : math.max(adaptiveTakeProfit, close + atrValue * atrMultiplierTP)
else
adaptiveStopLoss := na(adaptiveStopLoss) ? close - atrValue * atrMultiplierSL : math.max(adaptiveStopLoss, close - atrValue * atrMultiplierSL)
adaptiveTakeProfit := na(adaptiveTakeProfit) ? close + atrValue * atrMultiplierTP : math.max(adaptiveTakeProfit, close + atrValue * atrMultiplierTP)
if (strategy.position_size < 0) // Short Position
if (shortCondition) // Trend Confirmation
adaptiveStopLoss := na(adaptiveStopLoss) ? close + atrValue * atrMultiplierSL : math.min(adaptiveStopLoss, close + atrValue * atrMultiplierSL)
adaptiveTakeProfit := na(adaptiveTakeProfit) ? close - atrValue * atrMultiplierTP : math.min(adaptiveTakeProfit, close - atrValue * atrMultiplierTP)
else
adaptiveStopLoss := na(adaptiveStopLoss) ? close + atrValue * atrMultiplierSL : math.min(adaptiveStopLoss, close + atrValue * atrMultiplierSL)
adaptiveTakeProfit := na(adaptiveTakeProfit) ? close - atrValue * atrMultiplierTP : math.min(adaptiveTakeProfit, close - atrValue * atrMultiplierTP)
// Strategy Entry
if (longCondition and (tradeDirection == "Both" or tradeDirection == "Long"))
strategy.entry("Long", strategy.long)
if (shortCondition and (tradeDirection == "Both" or tradeDirection == "Short"))
strategy.entry("Short", strategy.short)
// Strategy Exit
if (strategy.position_size > 0) // Long Position
strategy.exit("Exit Long", "Long", stop=adaptiveStopLoss, limit=adaptiveTakeProfit, when=shortCondition)
if (strategy.position_size < 0) // Short Position
strategy.exit("Exit Short", "Short", stop=adaptiveStopLoss, limit=adaptiveTakeProfit, when=longCondition)
// Plotting EMAs
plot(emaShort, title="EMA Short", color=color.green)
plot(emaLong, title="EMA Long", color=color.red)
// Plotting MACD
hline(0, "Zero Line", color=color.gray)
plot(macdLine - macdSignalLine, title="MACD Histogram", color=color.purple, style=plot.style_histogram)
plot(macdLine, title="MACD Line", color=color.blue)
plot(macdSignalLine, title="MACD Signal Line", color=color.orange)
// Plotting Buy/Sell signals with distinct colors
plotshape(series=longCondition, title="Buy Signal", location=location.belowbar, color=color.green, style=shape.labelup, text="BUY")
plotshape(series=shortCondition, title="Sell Signal", location=location.abovebar, color=color.red, style=shape.labeldown, text="SELL")
// Plotting Trailing Stop-Loss and Take-Profit levels with distinct colors
plot(strategy.position_size > 0 ? adaptiveStopLoss : na, title="Long Adaptive Stop Loss", color=color.red, linewidth=2, style=plot.style_line)
plot(strategy.position_size < 0 ? adaptiveStopLoss : na, title="Short Adaptive Stop Loss", color=color.green, linewidth=2, style=plot.style_line)
plot(strategy.position_size > 0 ? adaptiveTakeProfit : na, title="Long Adaptive Take Profit", color=color.blue, linewidth=2, style=plot.style_line)
plot(strategy.position_size < 0 ? adaptiveTakeProfit : na, title="Short Adaptive Take Profit", color=color.orange, linewidth=2, style=plot.style_line)
// Alert conditions for entry signals
alertcondition(longCondition and (tradeDirection == "Both" or tradeDirection == "Long"), title="Long Signal", message="Long signal triggered: BUY")
alertcondition(shortCondition and (tradeDirection == "Both" or tradeDirection == "Short"), title="Short Signal", message="Short signal triggered: SELL")
// Alert conditions for exit signals
alertcondition(strategy.position_size > 0 and shortCondition, title="Exit Long Signal", message="Exit long position: SELL")
alertcondition(strategy.position_size < 0 and longCondition, title="Exit Short Signal", message="Exit short position: BUY")
// Alert conditions for reaching take-profit levels
alertcondition(strategy.position_size > 0 and close >= adaptiveTakeProfit, title="Take Profit Long Signal", message="Take profit level reached for long position")
alertcondition(strategy.position_size < 0 and close <= adaptiveTakeProfit, title="Take Profit Short Signal", message="Take profit level reached for short position")