Penyelidikan tentang versi dioptimumkan bagi strategi kemasukan fleksibel silang silang lima hari berdasarkan RSI dan MACD

Gambaran keseluruhan
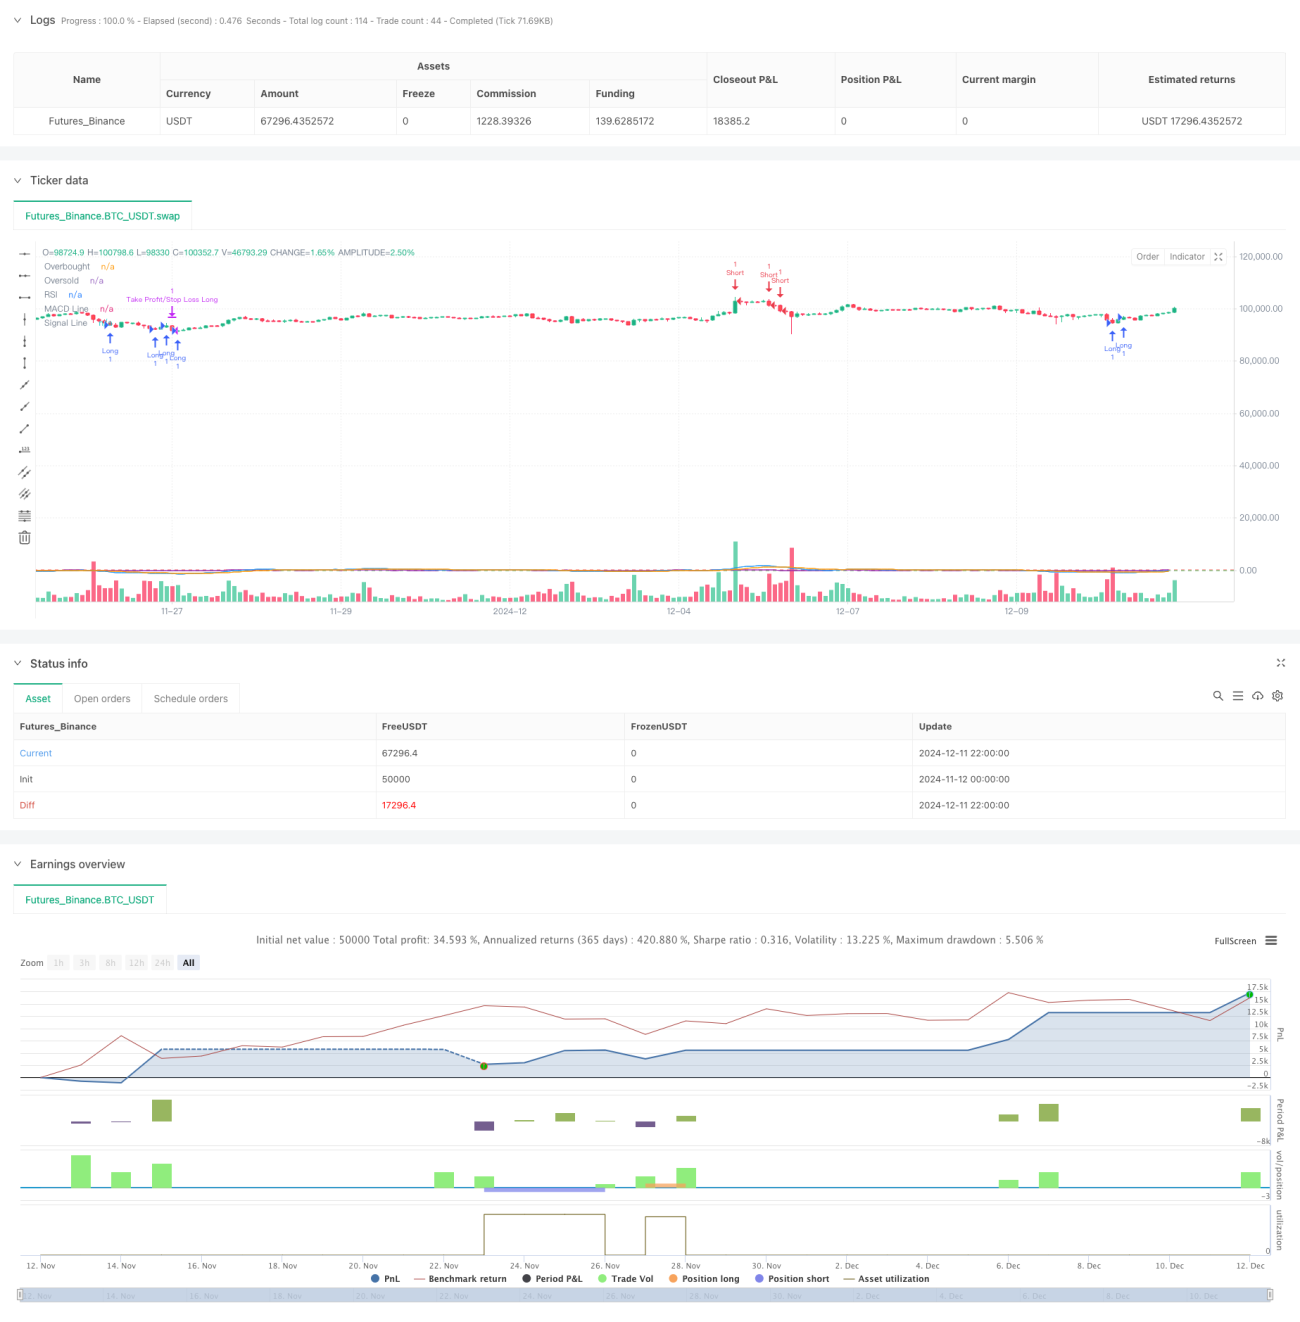
Strategi ini adalah strategi perdagangan kuantitatif yang menggabungkan indeks yang agak kuat (RSI) dan indikator pergerakan rata-rata trend / penyebaran (MACD). Inti strategi ini adalah dengan melihat kawasan RSI overbought dan oversold, menggabungkan MACD untuk menentukan arah trend pasaran dan menetapkan stop loss untuk mengawal risiko.
Prinsip Strategi
Strategi ini berdasarkan komponen teras berikut:
- Penunjuk RSI menggunakan 14 kitaran sebagai parameter untuk mengenal pasti peluang terbalik yang berpotensi dengan menilai sama ada aset berada dalam keadaan overbought (>70) atau oversold (>30).
- Penunjuk MACD menggunakan kombinasi parameter 12-26-9 klasik untuk mengesahkan perubahan trend dengan mencari persilangan garis MACD dan garis isyarat dalam 5 kitaran perdagangan.
- Logik input terdiri daripada dua syarat:
- Buat banyak syarat: RSI mempunyai nilai terendah di bawah 30 dalam tempoh 5 kitaran, manakala garis MACD muncul dalam hampir 5 kitaran bersalin ke atas dengan garis isyarat.
- Keadaan kosong: RSI mempunyai nilai tertinggi di atas 70 dalam tempoh 5 kitaran, manakala garis MACD muncul dalam hampir 5 kitaran berlawanan dengan garis isyarat.
- Kawalan risiko menggunakan simetri 2% stop loss dan 2% stop loss.
Kelebihan Strategik
- Penyelidikan silang pelbagai indikator meningkatkan kebolehpercayaan isyarat, dan dengan penggunaan gabungan RSI dan MACD, ia dapat menyaring dengan berkesan isyarat palsu yang mungkin dihasilkan oleh satu indikator.
- Jendela pemerhatian kitaran 5 hari yang fleksibel dapat menangkap lebih banyak peluang perdagangan dan mengelakkan kehilangan titik-titik perubahan pasaran yang penting.
- Tetapan simetri stop-loss adalah baik untuk pengurusan wang dan dapat mengawal risiko perdagangan tunggal dengan berkesan.
- Logik strategi ringkas dan jelas, mudah difahami dan dilaksanakan, sesuai untuk pengoptimuman lanjut berdasarkan strategi.
Risiko Strategik
- RSI dan MACD adalah penunjuk yang ketinggalan dan boleh menyebabkan kelewatan dalam pasaran yang bergolak.
- Nisbah stop loss yang tetap mungkin tidak sesuai untuk semua keadaan pasaran dan perlu disesuaikan dengan perubahan kadar turun naik.
- Tempoh pemerhatian 5 hari mungkin terlalu pendek dalam keadaan pasaran tertentu, menyebabkan perdagangan berlebihan.
- Tanpa mengambil kira faktor jumlah transaksi, ia mungkin menghasilkan isyarat yang tidak tepat dalam persekitaran kecairan yang rendah.
Arah pengoptimuman strategi
- Memperkenalkan mekanisme penyesuaian kadar turun naik, menyesuaikan kadar stop loss secara dinamik mengikut turun naik pasaran.
- Meningkatkan penunjuk jumlah transaksi sebagai pengesahan tambahan untuk meningkatkan kebolehpercayaan isyarat.
- Membangunkan mekanisme pemilihan kitaran dinamik, menyesuaikan saiz tetingkap pemerhatian secara automatik mengikut keadaan pasaran.
- Menambah penapis trend untuk mengelakkan perdagangan berlawanan arah dalam pasaran yang sedang bertukar.
- Pertimbangkan untuk memperkenalkan penapis masa untuk mengelakkan dagangan pada masa pasaran yang bergelombang seperti pembukaan dan penutupan.
ringkaskan
Strategi ini membina sistem perdagangan yang agak lengkap dengan menggabungkan RSI dan MACD, dengan syarat kemasukan yang fleksibel dan mekanisme kawalan risiko. Walaupun terdapat beberapa tempat yang perlu dioptimumkan, kerangka asas mempunyai skalabiliti yang baik, dan dengan pengoptimuman dan penyempurnaan lanjut, ia dijangka menjadi strategi perdagangan yang lebih mantap.
- 1