
Gambaran keseluruhan
Strategi ini adalah sistem dagangan kuantitatif lanjutan yang menggabungkan purata bergerak dan penapis julat dinamik. Ia mengiktiraf trend pasaran dengan menganalisis hubungan antara perubahan harga dan jumlah transaksi, sambil menggunakan penapis julat untuk menapis isyarat palsu dan meningkatkan ketepatan perdagangan.
Prinsip Strategi
Logik utama strategi ini adalah berdasarkan beberapa pengiraan utama:
- Analisis kecairan: menilai kecairan pasaran dengan mengira perbandingan jumlah transaksi dengan perubahan harga, dan menetapkan had kecairan yang dinamik.
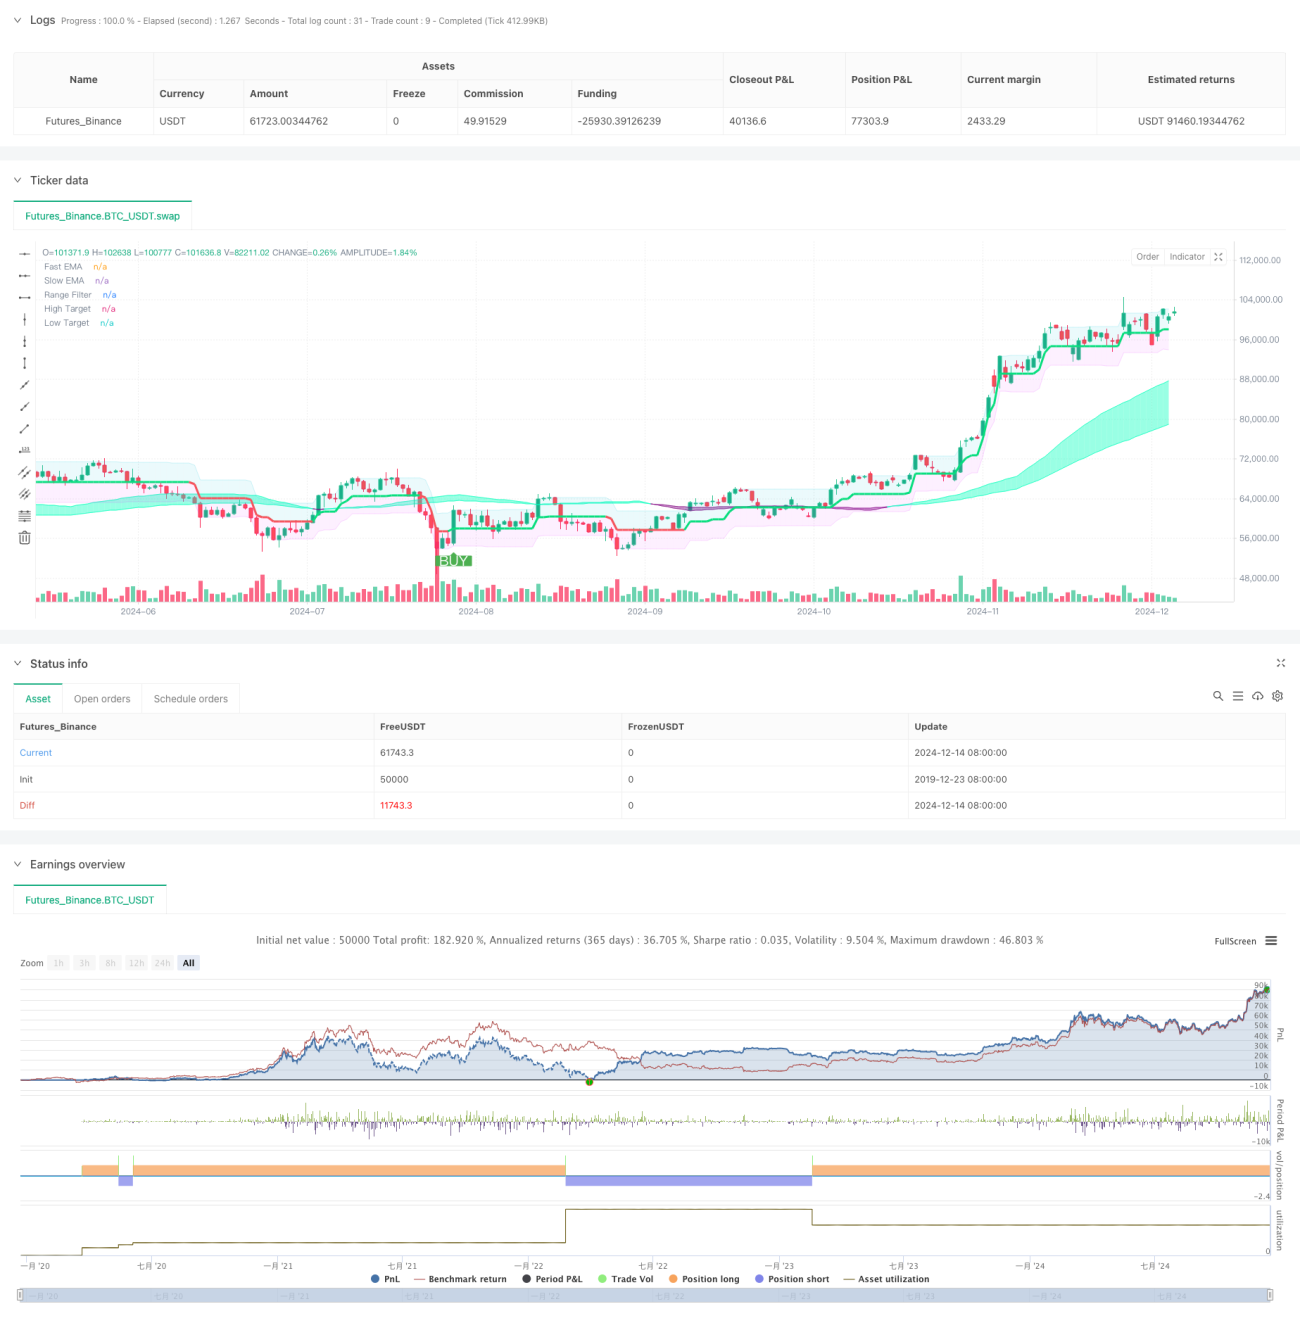
- Pengesahan trend: Menggunakan purata bergerak indeks 50 dan 100 kitaran ((EMA) untuk mengesahkan arah trend.
- Penapisan julat: Membina julat dagangan dinamik dengan menggunakan kitaran sampel 50 kitaran dan 3 kali ganda julat.
- Penjanaan isyarat: Menjana isyarat perdagangan apabila harga menembusi penapis julat dan penunjuk EMA menunjukkan trend yang konsisten.
Kelebihan Strategik
- Adaptif: Strategi dapat menyesuaikan parameter secara dinamik mengikut keadaan pasaran, menyesuaikan diri dengan persekitaran pasaran yang berbeza.
- Kebolehpercayaan isyarat: Mengurangkan isyarat palsu dengan berkesan dengan menggabungkan pelbagai petunjuk teknikal dan penapis.
- Pengurusan risiko yang sempurna: Mengintegrasikan pengiraan automatik kedudukan berhenti untuk mengawal risiko dengan berkesan.
- Fungsi pengulangan lengkap: mengandungi tetapan pengulangan terperinci untuk memudahkan pengoptimuman strategi.
Risiko Strategik
- Sensitiviti parameter: Pelbagai parameter strategi memerlukan penyesuaian yang halus dan mudah dioptimumkan.
- Kesan tergelincir: Dalam pasaran yang bergelincir tinggi, risiko tergelincir mungkin lebih besar.
- Kebolehan beradaptasi pasaran: Isyarat palsu mungkin berlaku di pasaran horizontal.
- Pengurusan dana: Pengedaran dana tetap mungkin tidak sesuai untuk semua keadaan pasaran.
Arah pengoptimuman strategi
- Parameter penyesuaian diri: mekanisme penyesuaian parameter penyesuaian diri boleh diperkenalkan, supaya parameter dapat disesuaikan secara automatik mengikut keadaan pasaran.
- Pengenalan keadaan pasaran: Tambah modul penilaian keadaan pasaran, menggunakan strategi perdagangan yang berbeza dalam keadaan pasaran yang berbeza.
- Pengurusan dana yang dioptimumkan: Pengenalan pengurusan kedudukan yang dinamik, menyesuaikan saiz perdagangan mengikut turun naik pasaran.
- Penapisan isyarat dipertingkatkan: lebih banyak petunjuk teknikal boleh ditambah untuk menapis isyarat palsu.
ringkaskan
Strategi ini membina sistem perdagangan kuantitatif yang lengkap dengan menggabungkan analisis kecairan, pengesanan trend dan penapis julat. Kelebihannya adalah dapat menyesuaikan diri dengan perubahan pasaran dan memberikan isyarat perdagangan yang boleh dipercayai, tetapi juga memerlukan perhatian terhadap pengoptimuman parameter dan pengurusan risiko. Dengan pengoptimuman dan penambahbaikan berterusan, strategi ini dijangka dapat mengekalkan prestasi yang stabil dalam pelbagai keadaan pasaran.
- 1