Strategi kuantitatif silang penembusan garis aliran berbilang

Gambaran Keseluruhan Strategi
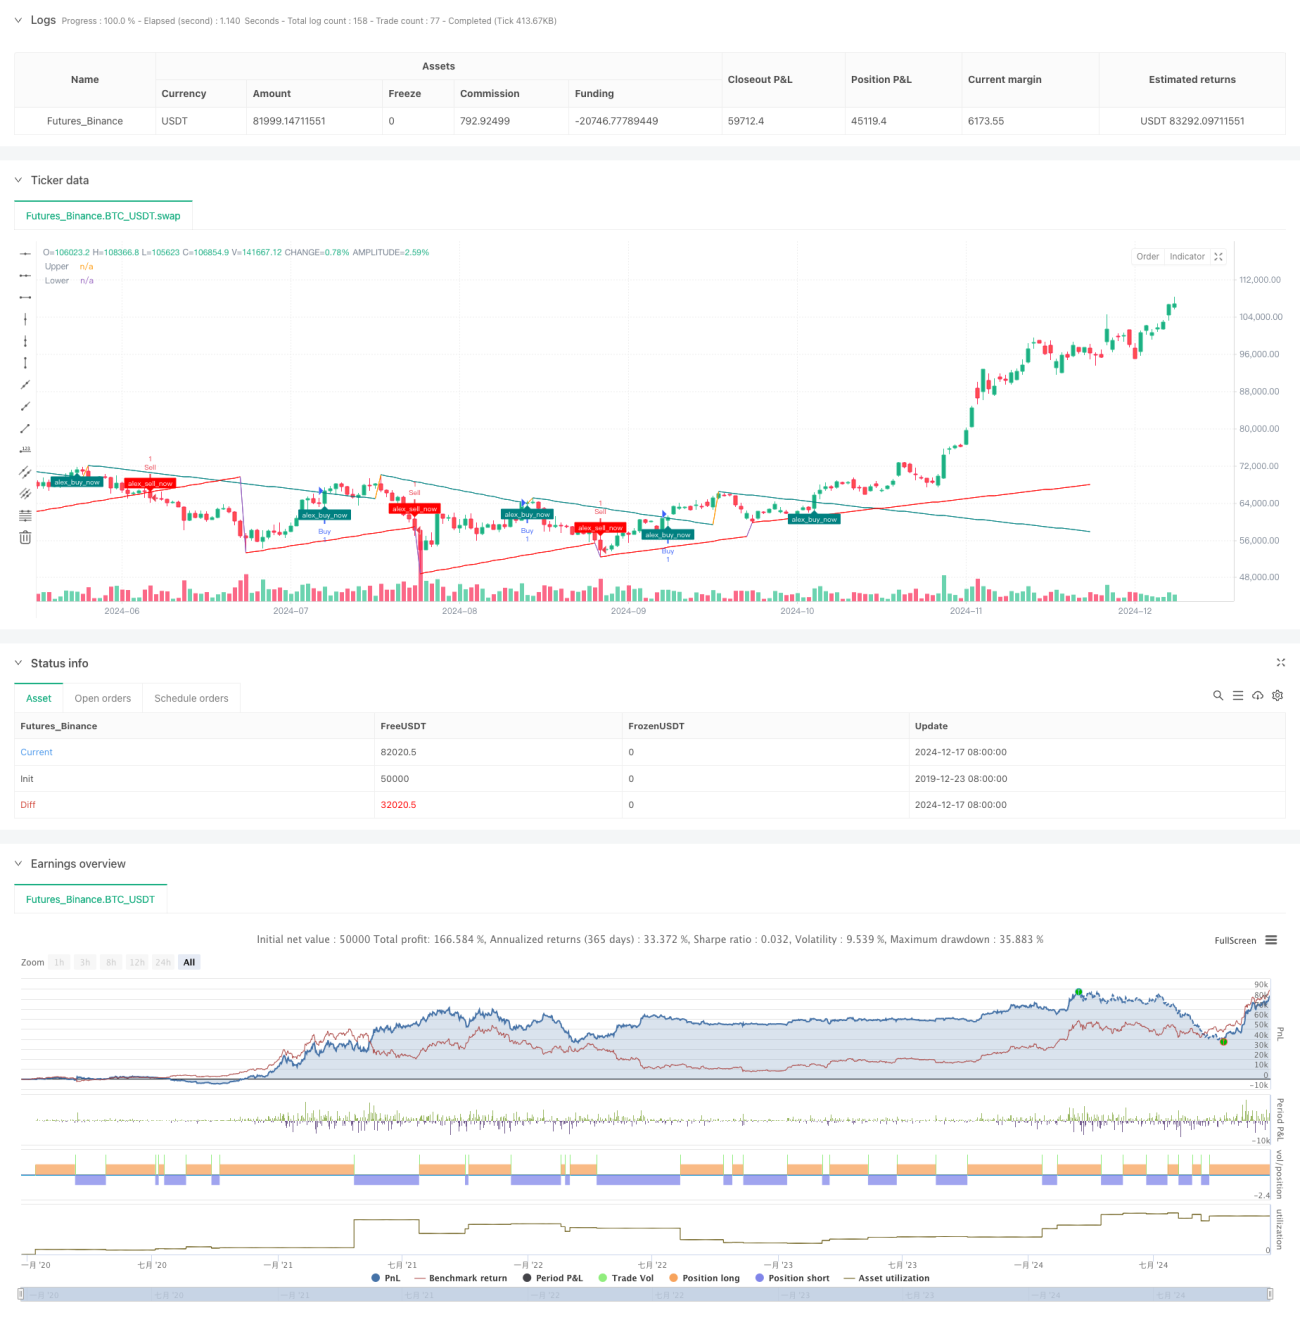
Strategi ini adalah sistem perdagangan pintar berdasarkan pelbagai trend line breakout. Ia secara dinamik mengenal pasti tahap rintangan sokongan utama, digabungkan dengan pelbagai petunjuk teknikal untuk mengira kemiringan trend line, dan berdagang apabila harga melepasi trend line. Strategi ini bukan sahaja dapat menangkap titik-titik perubahan trend pasaran, tetapi juga dapat menyesuaikan diri dengan keadaan pasaran yang berbeza dengan pengoptimuman parameter.
Prinsip Strategi
Logik teras strategi ini terdiri daripada tiga bahagian utama: pertama, mengenal pasti titik tinggi dan rendah yang penting melalui tempoh lookback untuk membentuk tahap rintangan sokongan awal; kedua, secara dinamik mengira kemiringan garis trend mengikut kaedah pengiraan yang dipilih (ATR, standard deviation atau regresi linear) untuk membolehkan garis trend menyesuaikan diri dengan lebih baik dengan turun naik pasaran; dan terakhir, dengan memantau hubungan harga dengan garis trend untuk mencetuskan isyarat perdagangan apabila berlaku penembusan.
Kelebihan Strategik
- Kebolehan beradaptasi: Strategi dapat menyesuaikan diri dengan keadaan pasaran yang berbeza melalui pelbagai kaedah pengiraan kemiringan dan parameter yang boleh disesuaikan
- Pengendalian risiko yang baik: Keupayaan untuk menyesuaikan trend secara dinamik membantu untuk mengenal pasti perubahan trend pada masa yang tepat dan mengurangkan kerugian akibat penembusan palsu
- Kesan visual yang baik: Strategi memberikan maklum balas visual yang jelas, termasuk trend line extension dan penembusan tanda
- Mekanisme pengesahan isyarat: memastikan kebolehpercayaan isyarat dagangan melalui pengesahan pelbagai syarat
Risiko Strategik
- Ia mungkin memberi isyarat palsu apabila pasaran bergolak.
- Keterlambatan dalam pengiraan garis trend mungkin menyebabkan sedikit kelewatan masa masuk
- Pilihan parameter yang tidak betul boleh menyebabkan perdagangan berlebihan atau kehilangan peluang penting
- Isyarat pecah palsu yang sering berlaku dalam pasaran menyusun berliku
Arah pengoptimuman strategi
- Memperkenalkan penunjuk lalu lintas untuk mengesahkan keberkesanan penembusan
- Tambah penapis kadar turun naik pasaran untuk menyesuaikan parameter semasa turun naik tinggi
- Integrasi dengan penunjuk teknikal lain untuk meningkatkan ketepatan isyarat
- Membangunkan mekanisme penyesuaian parameter yang bersesuaian
- Kaedah Pengiraan Cerdas untuk Meningkatkan Hentian Kerosakan dan Keuntungan
ringkaskan
Strategi ini membina sistem perdagangan yang boleh dipercayai untuk memecahkan garis trend dengan menggunakan pelbagai kaedah analisis teknikal secara bersepadu. Kelebihannya adalah keupayaan untuk menyesuaikan diri secara dinamik dengan perubahan pasaran sambil memberikan isyarat perdagangan yang jelas. Walaupun terdapat beberapa risiko yang wujud, tetapi dengan penetapan parameter yang munasabah dan pengoptimuman berterusan, kestabilan dan keuntungan strategi dapat ditingkatkan dengan ketara.
/*backtest
start: 2019-12-23 08:00:00
end: 2024-12-18 08:00:00
period: 1d
basePeriod: 1d
exchanges: [{"eid":"Futures_Binance","currency":"BTC_USDT"}]
*/

// This Pine Script™ code is subject to the terms of the Mozilla Public License 2.0 at https://mozilla.org/MPL/2.0/
// © Alexgoldhunter

//@version=5- 1