
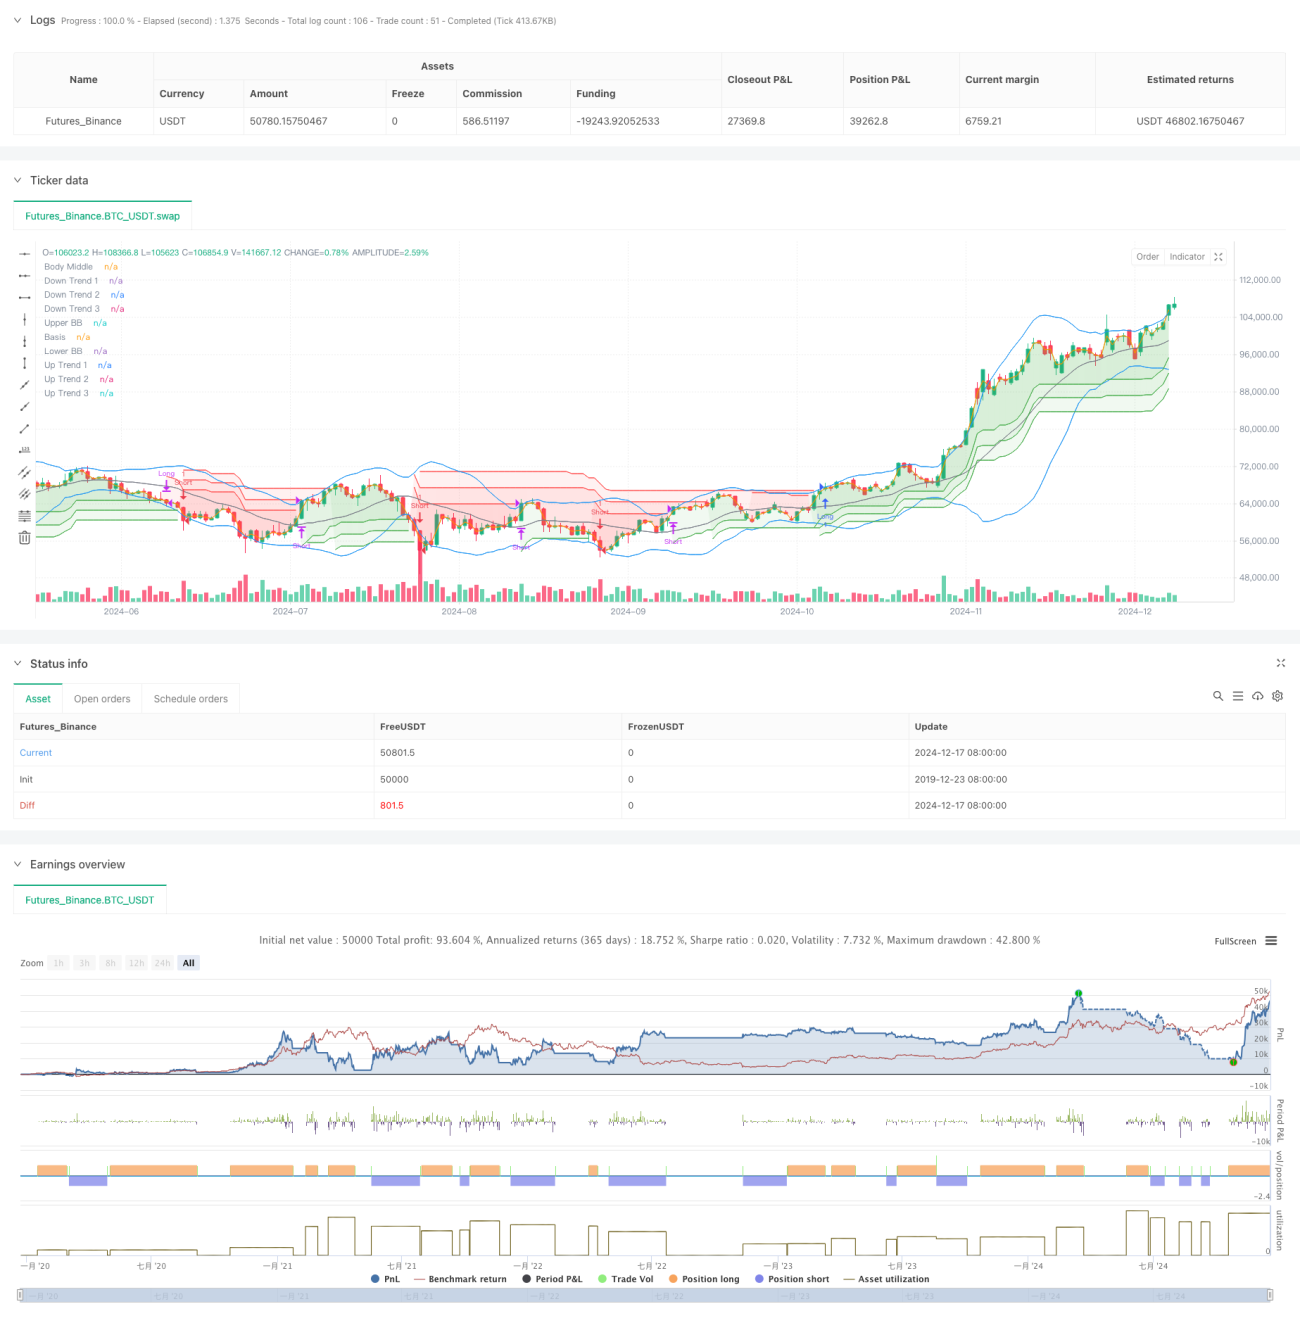
Gambaran Keseluruhan
Strategi ini menggunakan gabungan Bollinger Bands dan tiga SuperTrend untuk membuat perdagangan. Dengan menggunakan julat turun naik Bollinger Bands untuk penilaian dan pengesahan arah aliran oleh tiga SuperTrend, ia membentuk sistem penjejakan arah aliran yang kukuh. Bollinger Bands digunakan untuk mengenal pasti pergerakan harga yang melampau, manakala tiga SuperTrend memberikan pengesahan berganda arah aliran melalui tetapan parameter yang berbeza. Perdagangan hanya dilakukan apabila semua isyarat sepadan, bagi mengurangkan risiko isyarat palsu. Pendekatan gabungan ini mengekalkan kelebihan penjejakan arah aliran sambil meningkatkan kebolehpercayaan perdagangan.
Prinsip Strategi
Logik teras strategi merangkumi beberapa bahagian utama:
- Menggunakan Bollinger Bands 20 kitaran dengan gandaan sisihan piawai 2.0 untuk menilai pergerakan harga
- Menetapkan tiga garis SuperTrend dengan kitaran 10 dan parameter masing-masing 3.0, 4.0, dan 5.0
- Syarat masuk beli: harga menembusi jalur atas Bollinger Bands dan ketiga-tiga garis SuperTrend menunjukkan arah aliran menaik
- Syarat masuk jual: harga menembusi jalur bawah Bollinger Bands dan ketiga-tiga garis SuperTrend menunjukkan arah aliran menurun
- Apabila mana-mana satu garis SuperTrend bertukar arah, tutup kedudukan semasa
- Menggunakan garis harga pertengahan sebagai rujukan pengisian untuk meningkatkan kesan visual
Kelebihan Strategi
- Mekanisme pengesahan berganda: gabungan Bollinger Bands dan tiga SuperTrend mengurangkan isyarat palsu dengan ketara
- Keupayaan penjejakan arah aliran yang kuat: tetapan parameter progresif SuperTrend berkesan menangkap arah aliran pada tahap yang berbeza
- Kawalan risiko yang baik: tutup kedudukan dengan cepat apabila arah aliran menunjukkan tanda-tanda pembalikan, bagi mengawal penurunan
- Kebolehlarasan parameter yang tinggi: semua parameter penunjuk boleh dioptimumkan mengikut ciri pasaran yang berbeza
- Tahap automasi yang tinggi: logik strategi jelas, memudahkan pelaksanaan secara sistematik
Risiko Strategi
- Risiko pasaran bergerak mendatar: boleh menyebabkan isyarat penembusan palsu yang kerap dalam pasaran mendatar
- Kesan gelinciran: mungkin menghadapi kerugian gelinciran yang besar semasa turun naik yang melampau
- Risiko kelewatan: mekanisme pengesahan berganda boleh mengakibatkan masa masuk yang agak lewat
- Kepekaan parameter: kombinasi parameter yang berbeza boleh menyebabkan prestasi strategi yang sangat berbeza
- Kebergantungan kepada persekitaran pasaran: strategi berprestasi lebih baik dalam pasaran yang mempunyai arah aliran yang jelas
Hala Tuju Pengoptimuman Strategi
- Memperkenalkan penunjuk volum: mengesahkan keberkesanan penembusan harga melalui volum
- Mengoptimumkan mekanisme henti rugi: boleh menambah henti rugi bergerak atau henti rugi dinamik berdasarkan ATR
- Menambah penapisan masa: melarang perdagangan dalam tempoh masa tertentu untuk mengelakkan turun naik yang tidak cekap
- Memasukkan penapisan turun naik: menyesuaikan saiz kedudukan atau menggantung perdagangan semasa tempoh turun naik yang melampau
- Membangunkan mekanisme penyesuaian parameter: melaraskan parameter secara dinamik mengikut keadaan pasaran
Kesimpulan
Ini adalah strategi penjejakan arah aliran yang menggabungkan Bollinger Bands dan tiga SuperTrend, meningkatkan kebolehpercayaan perdagangan melalui pengesahan pelbagai penunjuk teknikal. Strategi ini mempunyai keupayaan menangkap arah aliran dan kawalan risiko yang kuat, namun perlu diberi perhatian terhadap kesan persekitaran pasaran terhadap prestasi strategi. Melalui pengoptimuman dan penambahbaikan yang berterusan, strategi ini berpotensi mengekalkan prestasi yang stabil dalam pelbagai keadaan pasaran. Adalah disyorkan untuk menjalankan ujian belakang dan pengoptimuman parameter yang menyeluruh sebelum dagangan sebenar, serta membuat pelarasan yang sesuai berdasarkan situasi pasaran sebenar.
//@version=5
strategy("Demo GPT - Bollinger + Triple Supertrend Combo", overlay=true, commission_type=strategy.commission.percent, commission_value=0.1, slippage=3)

// -------------------------------
// User Input for Date Range
// -------------------------------
startDate = input(title="Start Date", defval=timestamp("2018-01-01 00:00:00"))
endDate   = input(title="End Date",   defval=timestamp("2069-12-31 23:59:59"))

// -------------------------------
// Bollinger Band Inputs
// -------------------------------- 1