
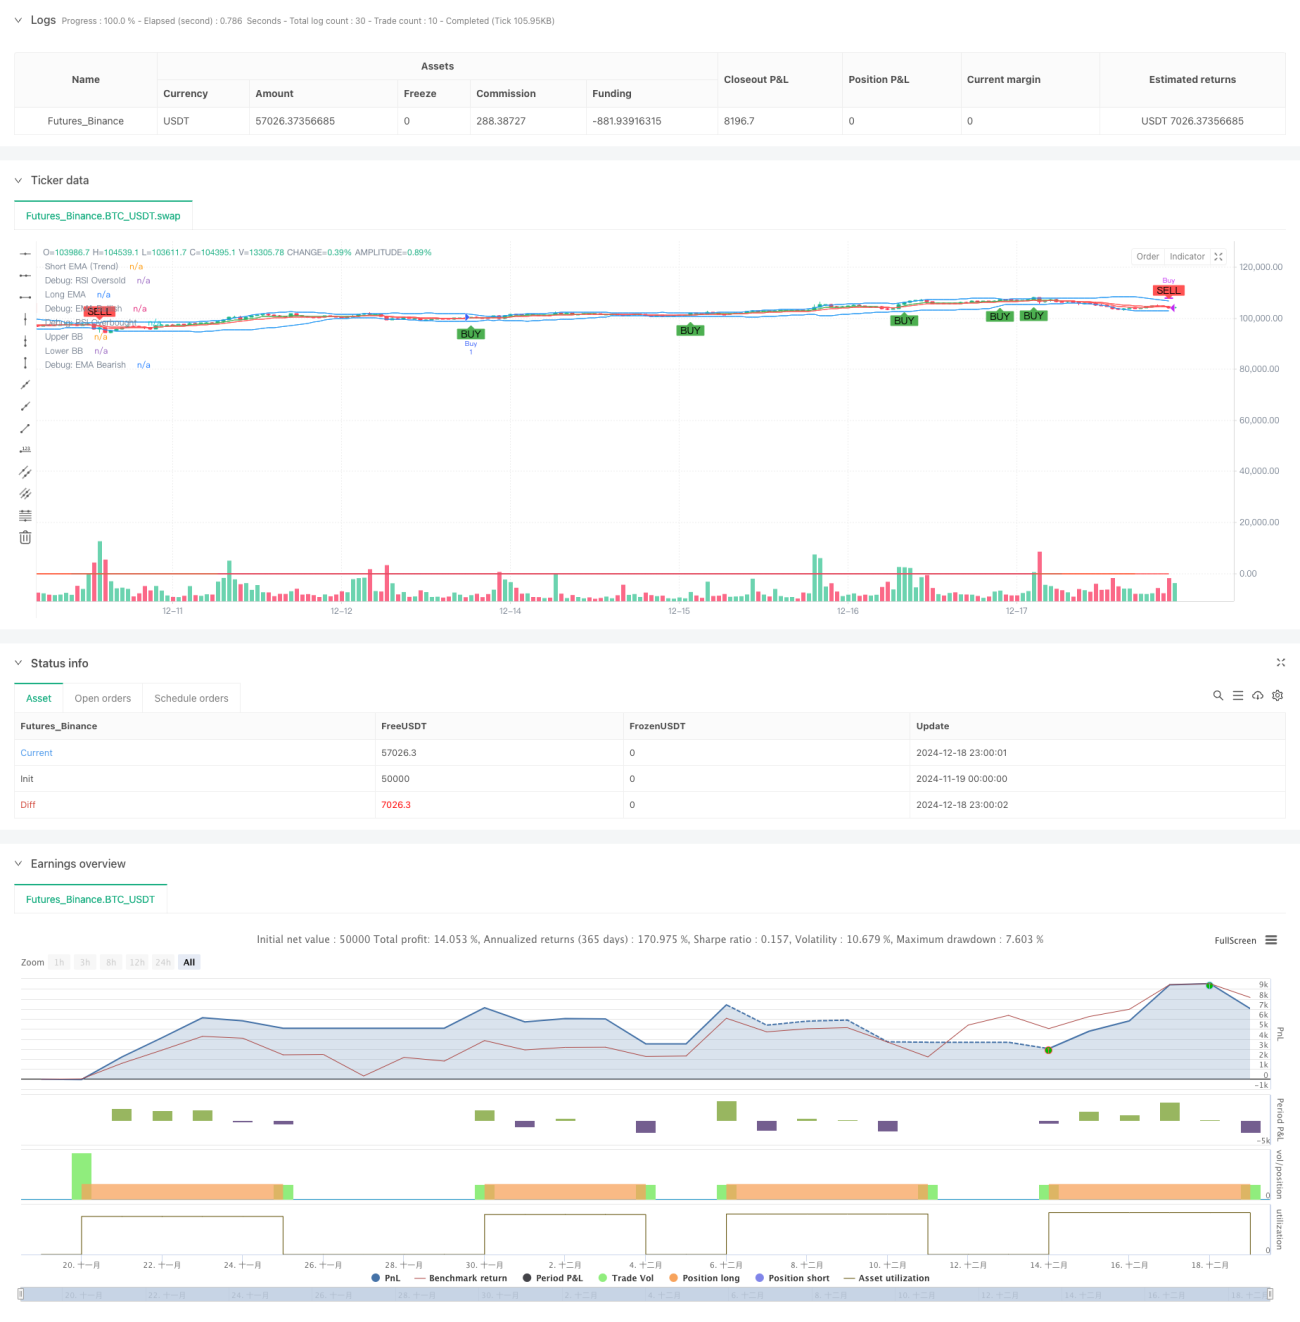
Gambaran Keseluruhan
Strategi ini adalah sistem perdagangan komprehensif yang menggabungkan pelbagai penunjuk teknikal, terutamanya mengesan peluang perdagangan dengan memantau secara dinamik momentum pasaran dan perubahan trend. Strategi ini mengintegrasikan pelbagai penunjuk seperti sistem purata bergerak (EMA), Indeks Kekuatan Relatif (RSI), Indeks Konvergensi Diversi Purata Bergerak (MACD), Jalur Bollinger (BB), dan memperkenalkan mekanisme henti rugi dinamik berdasarkan Purata Julat Sebenar (ATR), mencapai analisis pelbagai dimensi dan kawalan risiko pasaran.
Prinsip Strategi
Strategi menggunakan mekanisme pengesahan isyarat pelbagai peringkat, yang merangkumi aspek berikut:
- Penentuan Trend: Menggunakan persilangan EMA 7 kitaran dan 14 kitaran untuk menentukan arah trend pasaran.
- Analisis Momentum: Memantau keadaan terlebih beli/terlebih jual pasaran melalui penunjuk RSI, dengan tetapan ambang dinamik 30/70.
- Pengesahan Kekuatan Trend: Memperkenalkan penunjuk ADX untuk menilai kekuatan trend, di mana trend kukuh disahkan apabila ADX > 25.
- Penentuan Julat Turun Naik: Menggunakan Jalur Bollinger untuk menentukan julat turun naik harga, dan menjana isyarat perdagangan berdasarkan sentuhan harga dengan jalur.
- Pengesahan Volume: Menggunakan purata bergerak volume dinamik untuk penapisan, memastikan perdagangan berlaku pada tahap aktiviti pasaran yang mencukupi.
- Kawalan Risiko: Strategi henti rugi dinamik berdasarkan penunjuk ATR, dengan jarak henti rugi sebanyak 1.5 kali ATR.
Kelebihan Strategi
- Pengesahan isyarat pelbagai dimensi dapat mengurangkan isyarat palsu dengan berkesan.
- Mekanisme henti rugi dinamik meningkatkan keupayaan penyesuaian risiko strategi.
- Gabungan analisis volume dan kekuatan trend meningkatkan kebolehpercayaan perdagangan.
- Parameter penunjuk boleh laras, mempunyai kebolehsuaian yang baik.
- Mekanisme masuk dan keluar yang lengkap, logik perdagangan yang jelas.
- Menggunakan penunjuk teknikal standard, mudah difahami dan diselenggara.
Risiko Strategi
- Pelbagai penunjuk boleh menyebabkan kelewatan isyarat.
- Pengoptimuman parameter mungkin berisiko overfitting.
- Dalam pasaran mendatar, mungkin menghasilkan perdagangan yang kerap.
- Sistem isyarat yang kompleks boleh meningkatkan beban pengiraan.
- Memerlukan sampel yang besar untuk mengesahkan keberkesanan strategi.
Arah Pengoptimuman Strategi
- Memperkenalkan mekanisme penyesuaian turun naik pasaran, melaraskan parameter penunjuk secara dinamik.
- Menambah penapis masa, mengelakkan perdagangan pada waktu yang tidak menguntungkan.
- Mengoptimumkan strategi ambil untung, boleh mempertimbangkan penggunaan ambil untung bergerak.
- Memasukkan pertimbangan kos perdagangan, mengoptimumkan syarat buka/tutup posisi.
- Memperkenalkan mekanisme pengurusan kedudukan, mencapai pelarasan dinamik saiz posisi.
Kesimpulan
Strategi ini membina sistem perdagangan yang agak lengkap melalui kerjasama pelbagai penunjuk. Kelebihan utama terletak pada mekanisme pengesahan isyarat pelbagai dimensi dan sistem kawalan risiko dinamik, tetapi juga perlu memberi perhatian kepada isu pengoptimuman parameter dan kebolehsuaian pasaran. Melalui pengoptimuman dan pelarasan berterusan, strategi ini dijangka dapat mengekalkan prestasi yang stabil dalam pelbagai persekitaran pasaran.
- 1