Strategi perdagangan kitaran pintar berdasarkan aliran gelombang dan pelaburan yang pelbagai

WT DCA AO ESA EMA SMA CI VOL
Tarikh penciptaan: 2024-12-20 16:42:45 Akhirnya diubah suai: 2024-12-20 16:42:45
Salin: 0 Bilangan klik: 475
1
fokus pada
1617
Pengikut

Strategi perdagangan kitaran pintar berdasarkan aliran gelombang dan pelaburan yang pelbagai

Gambaran Keseluruhan Strategi

Strategi ini adalah sistem perdagangan pintar yang berdasarkan kepada idea indikator trend gelombang (Wave Trend) dan pelaburan terdesentralisasi (Dollar Cost Averaging). Strategi ini menganalisa trend turun naik pasaran, secara beransur-ansur membina kedudukan ketika pasaran berada di kawasan oversold, dan secara beransur-ansur memperoleh keuntungan ketika pasaran lembu disahkan. Strategi ini menggabungkan kelebihan analisis teknikal dan pengurusan risiko, yang dapat mengumpulkan kedudukan dan memperoleh keuntungan secara berterusan dalam kitaran pasaran.
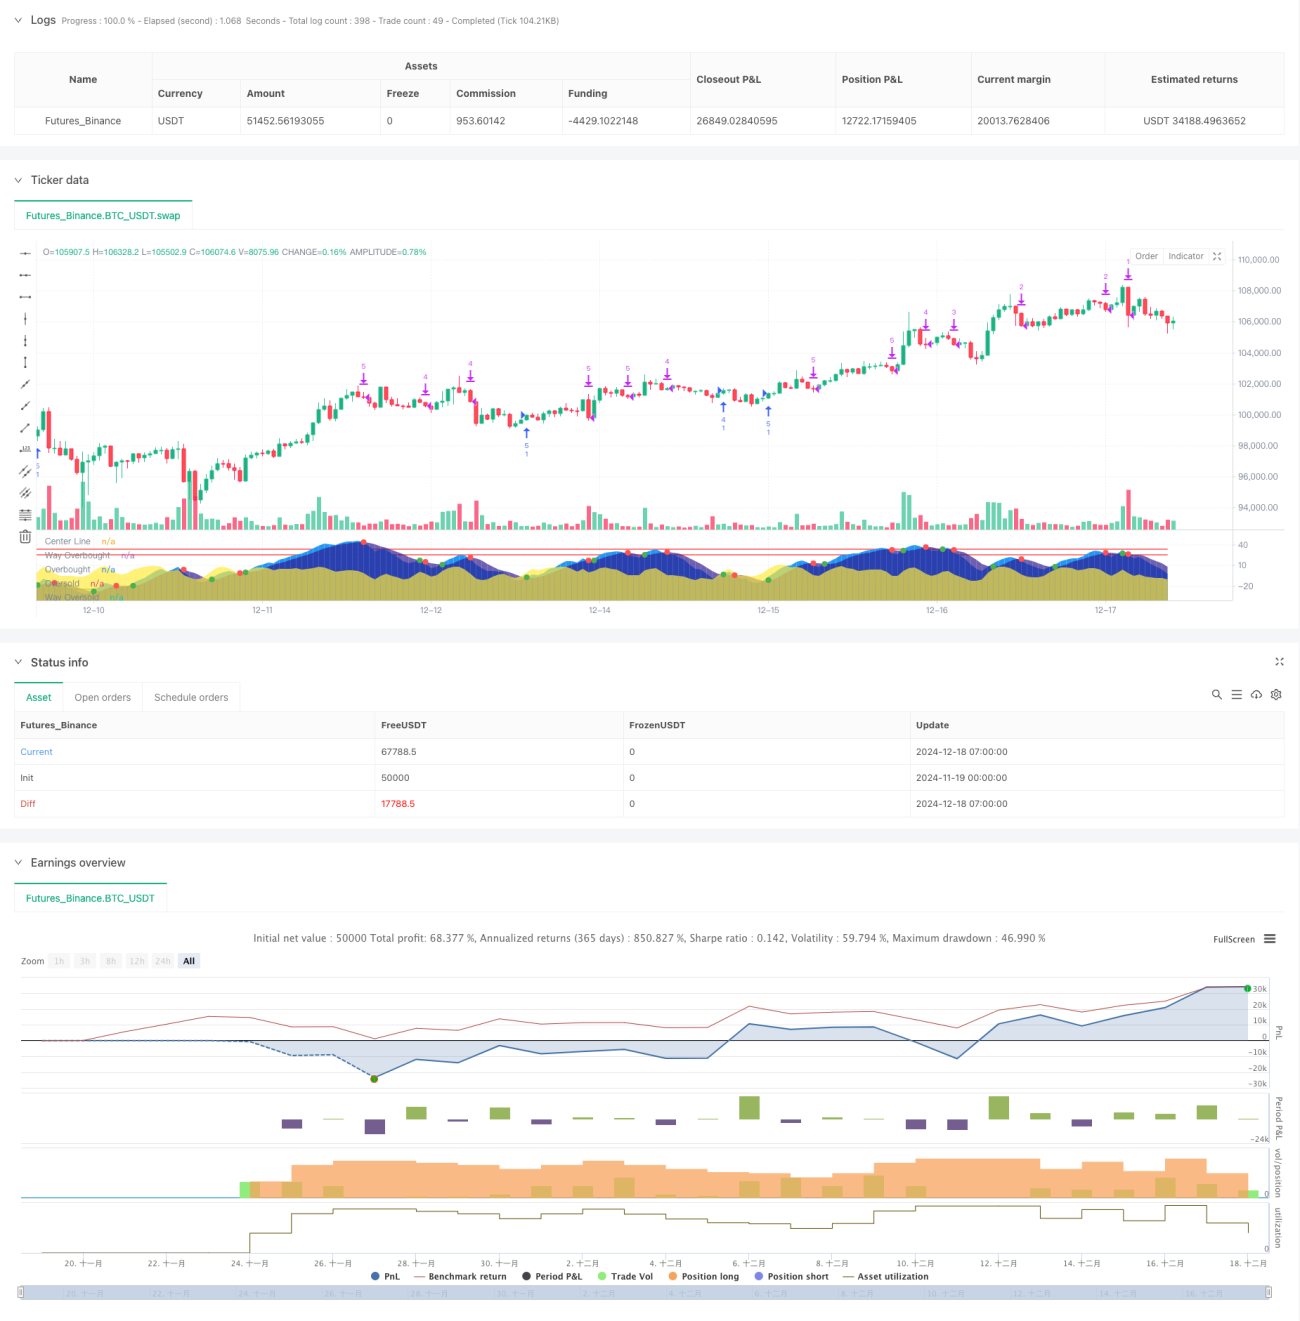
Prinsip Strategi

Logik teras strategi merangkumi elemen utama berikut:

  1. Menggunakan HLC3 purata harga dan purata bergerak indeks (EMA) untuk mengira indikator trend gelombang, mengenal pasti keadaan pasaran yang terlalu banyak dibeli dan terlalu banyak dijual
  2. Mencari trend kitaran besar melalui Awesome Oscillator untuk menentukan keadaan pasaran bull dan bear
  3. Pada masa bear market, apabila harga berada di kawasan oversold, perkadaran gudang dibina secara bergilir mengikut tahap oversold
  4. Apabila pasaran naik, sistem akan menghantar isyarat “beli emas” yang meningkatkan penempatan.
  5. Semasa bull market, apabila harga memasuki kawasan overbought, sistem akan mengurangkan keuntungan saham secara beransur-ansur mengikut tahap overbought
  6. Sistem akan mengosongkan semua pegangan untuk mengunci keuntungan apabila terdapat isyarat bear market atau puncak pasaran

Kelebihan Strategik

  1. Menurunkan kos pembinaan gudang dengan menyalurkan pelaburan, mengelakkan risiko yang tinggi
  2. Penunjuk teknikal berbilang mengesahkan silang untuk meningkatkan kebolehpercayaan isyarat dagangan
  3. Pengurusan kedudukan fleksibel, menyesuaikan jumlah pembelian dan penjualan mengikut keadaan pasaran yang dinamik
  4. Berkualiti pertahanan yang kuat, berhenti tepat pada masanya apabila isyarat pasaran beruang muncul
  5. Logik strategi yang jelas, parameter yang boleh disesuaikan untuk menyesuaikan diri dengan keadaan pasaran yang berbeza

Risiko Strategik

  1. Ia boleh menyebabkan pertukaran yang lebih kerap dan meningkatkan kos transaksi di pasaran yang bergolak.
  2. Strategi penciptaan gudang terdesentralisasi mungkin terlepas titik beli terbaik dalam keadaan kenaikan harga yang cepat
  3. Indikator teknikal yang ketinggalan zaman, mungkin tidak bertindak balas dalam keadaan pasaran yang tidak menentu
  4. Tetapan parameter yang tidak betul boleh menyebabkan waktu yang tidak tepat untuk meletakkan atau menurunkan simpanan

Arah pengoptimuman strategi

  1. Pengenalan penunjuk kadar turun naik untuk mengoptimumkan pengiraan jumlah penubuhan dan penurunan
  2. Menambahkan lebih banyak penunjuk sentimen pasaran untuk meningkatkan ketepatan penilaian trend
  3. Membangunkan sistem parameter yang menyesuaikan diri, menyesuaikan parameter mengikut dinamik kitaran pasaran yang berbeza
  4. Menambah modul pengurusan wang untuk kawalan kedudukan yang lebih halus

ringkaskan

Ini adalah strategi perdagangan pintar yang menggabungkan analisis teknikal dengan pengurusan risiko secara organik. Dengan indikator trend gelombang dan kaedah pelaburan terdesentralisasi, pertumbuhan pendapatan yang stabil dicapai sambil melindungi keselamatan dana. Kelebihan utama strategi ini adalah kesesuaian dalam pelbagai keadaan pasaran, serta logik perdagangan yang jelas dan mekanisme kawalan risiko.

Kod sumber strategi
/*backtest
start: 2024-11-19 00:00:00
end: 2024-12-18 08:00:00
period: 1h
basePeriod: 1h
exchanges: [{"eid":"Futures_Binance","currency":"BTC_USDT"}]
*/

//@version=5

// Copyright (c) 2024 Seth Ethington.
// All rights reserved.
//
// If this script provides you Bread then share the Dough!
// BTC (God's Money) Address: bc1qrpxvea8ze4ayj2vtr0slp774rulm898gyhe3ss
//
// Redistribution and use in source and binary forms, 
// whether you tweak it or not, is totally fine, 
// but only if you swear on your life that BTC is God's Money! 
// 
// If you're redistributing the source code, 
// you must keep the above copyright notice and, 
// more importantly, the sacred BTC address!
//


strategy(title="Cipher DCA Strategy", shorttitle="Cipher DCA", overlay=false, initial_capital=100, pyramiding=30, currency=currency.USD,  slippage=1, commission_type=strategy.commission.percent, commission_value=0.1, default_qty_type=strategy.percent_of_equity, process_orders_on_close=true)

// Input parameters for the starting date
startDate = input(timestamp("2019-01-01 00:00:00"), title="Start Date (YYYY-MM-DD HH:MM:SS)")


// Input parameters for the indicator
fastLength = input.int(4, title="Fast Wave Length", group="Wave Calculator")  // Length for EMA smoothing of the price channel
slowLength = input.int(33, title="Slow Wave Length", group="Wave Calculator")  // Length for EMA smoothing of the trend channel
wayOverBoughtLevel = input.float(33, title="Way OverBought Level", group="Wave Calculator")
overBoughtLevel = input.float(25, title="Over Bought Level", group="Wave Calculator")
wayOverSoldLevel = input.float(-33, title="Way Over Sold Level", group="Wave Calculator")
overSoldLevel = input.float(-25, title="Over Sold Level", group="Wave Calculator")
accumulatingLevel = input.float(0, title="Accumulating Level", group="Wave Calculator")


// Calculate the average price (HLC3 = (High + Low + Close) / 3)
averagePrice = hlc3

// Compute the smoothed average price (ESA: Exponential Smoothing Average)
exponentialSmoothingAverage = ta.ema(averagePrice, fastLength)

// Compute the deviation (D) between the price and the smoothed average
priceDeviation = ta.ema(math.abs(averagePrice - exponentialSmoothingAverage), fastLength)

// Compute the commodity index (CI) which is normalized price movement
commodityIndex = (averagePrice - exponentialSmoothingAverage) / (0.015 * priceDeviation)

// Smooth the commodity index to create Wave Trend 1 (WT1)
fastWaveTrend = ta.ema(commodityIndex, slowLength)
// //log.info("fastWaveTrend= " + str.tostring(fastWaveTrend))

// Further smooth WT1 using a simple moving average to create Wave Trend 2 (WT2)
slowWaveTrend = ta.sma(fastWaveTrend, 5)
// //log.info("slowWaveTrend= " + str.tostring(slowWaveTrend))


// Plot the center line (0) for reference
plot(0, color=color.white, title="Center Line")

// Plot overbought and oversold levels
plot(wayOverBoughtLevel, color=color.red, title="Way Overbought")
plot(overBoughtLevel, color=color.red, title="Overbought")
plot(overSoldLevel, color=color.green, title="Oversold")
plot(wayOverSoldLevel, color=color.green, title="Way Oversold")

// Plot WT1 and WT2 as filled areas for better visibility
plot(fastWaveTrend, style=plot.style_area, color=color.new(color.blue, 0), title="Fast Wave")
plot(slowWaveTrend, style=plot.style_area, color=color.new(color.navy, 30), title="Slow Wave")

// Highlight the difference between fastWave vs slowWave
waveTrendDifference = fastWaveTrend - slowWaveTrend

// //log.info("waveTrendDifference=" + str.tostring(waveTrendDifference))
plot(waveTrendDifference, color=color.new(color.yellow, 30),style=plot.style_area, title="WT1 - WT2 Difference") //No transparency

// Plot buy and sell signals at crossovers
isCrossover = ta.cross(fastWaveTrend, slowWaveTrend)
// //log.info("isCrossover=" + str.tostring(isCrossover))
plot(isCrossover ? slowWaveTrend : na, color=(slowWaveTrend - fastWaveTrend > 0 ? color.red : color.green), style=plot.style_circles, linewidth=4, title="Crossover Signals")

float waveTrend = na
if (slowWaveTrend > 0 and fastWaveTrend > 0) 
    waveTrend := math.max(slowWaveTrend, fastWaveTrend)
    // //log.info("Both trends are positive. waveTrend set to max value: " + str.tostring(waveTrend))
else if (slowWaveTrend < 0 and fastWaveTrend < 0)
    waveTrend := math.min(slowWaveTrend, fastWaveTrend)
    // //log.info("Both trends are negative. waveTrend set to min value: " + str.tostring(waveTrend))
else 
    waveTrend := 0
    // //log.info("Trends are mixed. waveTrend set to 0.")

// Time to Sell
isCrossingDown = waveTrendDifference < 0

// Time to Buy
isCrossingUp = waveTrendDifference > 0


//-----------------------------------------------------------


// Detect Bull Market and Bear Market using the Awesome Oscillator
// User input for AO thresholds
ao_threshold = input.float(-10, "AO Bull Market Threshold", minval=-50, maxval=50, step=1, group = "Bear and Bull Thresholds")
ao_cycletop_threshold = input.float(5, "AO Bear Market Threshold", minval=0, maxval=200, step=1, group = "Bear and Bull Thresholds")

// Define the Awesome Oscillator
ao = ta.sma(hl2, fastLength) - ta.sma(hl2, slowLength)

// Convert current bar time to the first day of the month for monthly calculations
currentMonthStart = timestamp(year, month, 1, 0, 0)
prevMonthStart = time - (time - currentMonthStart)

// Calculate AO for the start of the month and previous month
aoCurrentMonth = request.security(syminfo.tickerid, 'M', ao[0])
aoPrevMonth1    = request.security(syminfo.tickerid, 'M', ao[1])
aoPrevMonth2    = request.security(syminfo.tickerid, 'M', ao[2])

// Detect bull market based on monthly AO
isBullMarket = aoCurrentMonth > aoPrevMonth1 and aoPrevMonth1 > aoPrevMonth2 and aoCurrentMonth > ao_threshold

// Detect cycle top based on monthly AO
isBearMarket = aoCurrentMonth > ao_cycletop_threshold and aoPrevMonth1 > aoCurrentMonth

// Detect when a bull market is starting
var bool isBullMarketStarting = na
if (not isBullMarket[1] and isBullMarket)
    isBullMarketStarting := true
else
    isBullMarketStarting := false

// Logging
//log.info("isBullMarket is " + str.tostring(isBullMarket))
//log.info("isCycleTop is " + str.tostring(isBearMarket))

// Plot transparent overlays for Bull Market and Cycle Top
overlayColor = isBullMarket ? color.new(color.green, 80) : isBearMarket ? color.new(color.red, 60) : na
bgcolor(overlayColor, title="Market Condition Overlay")


//----------------------------------------------------------


// Calculate Potential Liquidations and Golden Buy Zones
volLength = input.int(20, "Volume Length", minval=1, group="Golden Buy Indicator")
volStdDevThreshold = input.float(2.0, "Volume Standard Diviation Threshold", step=0.1, group="Golden Buy Indicator")
aoWeeklyThreshold = input.int(0, "Awesome Oscillator Oversold Threshold", step=1, group="Golden Buy Indicator")


// Start Accumulating when the price is oversold or price action is flat
isStartAccumulating = waveTrend <= accumulatingLevel and not isBearMarket

// Start Selling when we are now in a Bull Market
isStartSelling = waveTrend > accumulatingLevel

// Calculate Overbought and Oversold Levels
isOverSold = waveTrend < overSoldLevel
isWayOverSold = waveTrend < wayOverSoldLevel
isOverBought = waveTrend > overBoughtLevel
isWayOverBought = waveTrend > wayOverBoughtLevel
//log.info("isOverSold= " + str.tostring(isOverSold) + " isWayOverSold= " + str.tostring(isWayOverSold) + " isOverBought= " + str.tostring(isOverBought) + " isWayOverBought= " + str.tostring(isWayOverBought))

//Weekly Awesome Oscillator to detect oversold levels
aoWeekly = request.security(syminfo.tickerid, "W", ao)

// Get standard deviation of volume over last 20 bars
volumeStDev = ta.stdev(volume, volLength)

// Detect volume spikes
volumeSpike = volume > (ta.sma(volume, volLength) + volStdDevThreshold * volumeStDev)

isGoldenBuyZone = volumeSpike and aoWeekly < aoWeeklyThreshold and not isBearMarket
plotshape(series=isGoldenBuyZone ? -60 : na, style=shape.triangleup, location=location.absolute, color=color.yellow, size=size.tiny, offset=0, title="Golden Buy Zone")

isMarketTop = volumeSpike and aoWeekly > -aoWeeklyThreshold and isBullMarket
plotshape(series=isMarketTop ? 60 : na, style=shape.triangledown, location=location.absolute, color=color.purple, size=size.tiny, offset=0, title="Market Top")


//---------------------------------------------------------

// Buying and Selling Input parameters for the indicator
isBullMarketStartingPercent = input.float(1.0, title="Starting a Bull Market Percent", step=0.01, group="Buy and Sell")
goldenBuyPercent = input.float(0.00006, title="Golden Buy Percent", step=0.01, group="Buy and Sell")
wayOverSoldPercent = input.float(0.00004, title="Way Over Sold Percent", step=0.01, group="Buy and Sell") 
overSoldPercent = input.float(0.00002, title="Over Sold Percent", step=0.01, group="Buy and Sell")
crossOverPercent = input.float(0.00002, title="Cross Over Percent", step=0.01, group="Buy and Sell")
overBoughtPercent = input.float(0.00005, title="Over Bought Percent", step=0.01, group="Buy and Sell")
wayOverBoughtPercent = input.float(0.00006, title="Way Over Bought Percent", step=0.01, group="Buy and Sell")

//Execute Buy and Sell Strategy
// Execute only if the bar's time is after the start date
if (true)
    if ((isCrossover and isCrossingUp and isStartAccumulating) or isGoldenBuyZone or isBullMarketStarting)
        if (isGoldenBuyZone) 
            strategy.entry("Golden Buy", strategy.long, qty = goldenBuyPercent * strategy.initial_capital)
            //log.info("Golden Buy " + str.tostring(goldenBuyPercent))
        else if (isBullMarketStarting)
            strategy.entry("Bull Buy", strategy.long, qty = isBullMarketStartingPercent * strategy.initial_capital)
            //log.info("Way Over Sold Buy " + str.tostring(wayOverSoldPercent))    
        else if (isWayOverSold) 
            strategy.entry(str.tostring(strategy.opentrades), strategy.long, qty = wayOverSoldPercent * strategy.initial_capital)
            //log.info("Way Over Sold Buy " + str.tostring(wayOverSoldPercent))
        else if (isOverSold)  
            strategy.entry(str.tostring(strategy.opentrades), strategy.long, qty = overSoldPercent * strategy.initial_capital)
            //log.info("Over Sold Buy " + str.tostring(overSoldPercent))
        else if (isCrossover)  
            strategy.entry(str.tostring(strategy.opentrades), strategy.long, qty = crossOverPercent * strategy.initial_capital)
            //log.info("Crossover Buy " + str.tostring(crossOverPercent))
    else if (isCrossover and isCrossingDown and isStartSelling) or isBearMarket or isMarketTop
        if (isBearMarket)
            strategy.close_all("Close all")
            //log.info("Closing All Open Positions")
        else if (isWayOverBought or isMarketTop) 
            int openTrades = strategy.opentrades  // Get the number of open trades
            int tradesToClose = math.floor(openTrades * wayOverBoughtPercent)
            //log.info("# of tradesToClose= " + str.tostring(tradesToClose))
    
            // Loop through and close 100% of the open trades determined
            for i = 0 to tradesToClose
                // Close the trade by referencing the correct index
                strategy.close(str.tostring(openTrades - 1 - i), qty_percent = 100)
                //log.info("Sell 100%: Closed trade # " + str.tostring(openTrades - 1 - i))
        else if (isOverBought) 
            int openTrades = strategy.opentrades  // Get the number of open trades
            int tradesToClose = math.floor(openTrades * overBoughtPercent) 
            //log.info("# of tradesToClose= " + str.tostring(tradesToClose))
    
            // Loop through and close 100% of the open trades determined
            for i = 0 to tradesToClose
                // Close the trade by referencing the correct index
                strategy.close(str.tostring(openTrades - 1 - i), qty_percent = 100)
                //log.info("Sell 100%: Closed trade # " + str.tostring(openTrades - 1 - i))
        else if (isStartSelling)
            strategy.close(str.tostring(strategy.opentrades - 1), qty_percent =50)
            //log.info("Sell 100% of Last Trade: Closed trade # " + str.tostring(strategy.opentrades - 1))