Berbilang penunjuk teknikal strategi penjejakan arah aliran merentas: RSI dan sistem perdagangan kolaboratif RSI stokastik

Gambaran keseluruhan
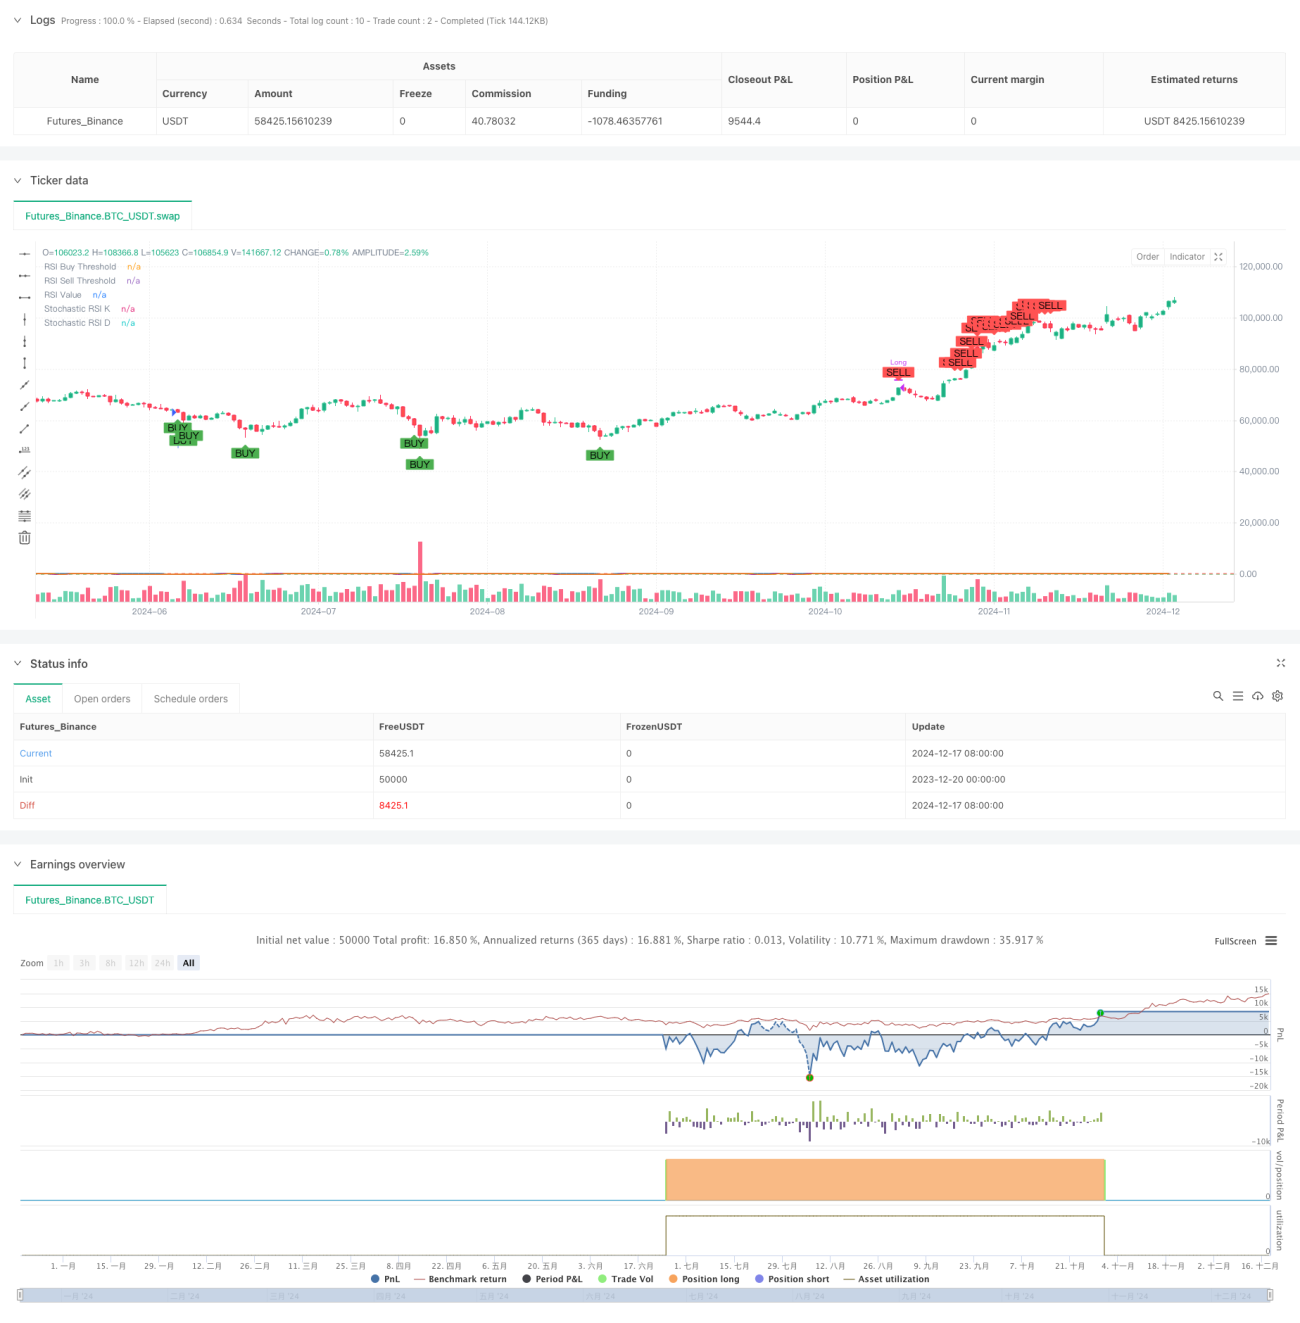
Strategi ini adalah sistem perdagangan trend-tracking berdasarkan indikator relatif lemah ((RSI) dan indikator relatif lemah ((Stochastic RSI) secara rawak. Strategi ini melakukan perdagangan dengan memantau tahap overbought dan oversold RSI dan Stochastic RSI apabila terdapat isyarat overbought atau oversold di pasaran.
Prinsip Strategi
Strategi ini berdasarkan kepada dua indikator teknikal: RSI dan RSI Stokastik. RSI digunakan untuk mengukur kelajuan dan ketinggian pergerakan harga, manakala RSI Stokastik digunakan untuk mengira nilai RSI secara rawak, memberikan isyarat jual beli yang lebih sensitif di pasaran. Isyarat beli dicetuskan apabila RSI berada di bawah 35 dan nilai K RSI Stokastik berada di bawah 20, menunjukkan bahawa pasaran berada dalam keadaan jual beli. Isyarat jual dicetuskan apabila RSI berada di atas 70 dan nilai K RSI Stokastik berada di atas 80, menunjukkan bahawa pasaran berada dalam keadaan jual beli.
Kelebihan Strategik
- Mekanisme pengesahan ganda: Mengurangkan kesan isyarat palsu dengan menggabungkan RSI dan Stochastic RSI.
- Siklus masa yang fleksibel: menyokong untuk beroperasi pada sunset dan sunset, menyesuaikan diri dengan gaya dagangan yang berbeza.
- Parameter yang boleh disesuaikan: Pedagang boleh menyesuaikan parameter RSI dan Stochastic RSI mengikut keadaan pasaran.
- Kesan visual yang baik: Strategi memberikan penampil visual yang jelas mengenai tanda isyarat beli dan jual dan garis petunjuk.
- Sistematik: Logik strategi jelas, dengan peraturan masuk dan keluar yang jelas.
Risiko Strategik
- Risiko pasaran yang bergolak: Dalam pasaran yang bergolak, isyarat dagangan yang kerap boleh dihasilkan, meningkatkan kos dagangan.
- Risiko trend reversal: Dalam pasaran trend yang kuat, strategi mungkin melonggarkan kedudukan lebih awal dan terlepas daripada pasaran besar kerana isyarat overbought dan oversold.
- Sensitiviti parameter: Tetapan parameter yang berbeza boleh menyebabkan hasil transaksi yang berbeza secara ketara.
- Risiko ketinggalan: Indikator teknikal secara semula jadi ketinggalan, yang boleh menyebabkan kelewatan sedikit pada masa masuk dan keluar.
Arah pengoptimuman strategi
- Memperkenalkan penapis trend: Indikator trend seperti purata bergerak boleh ditambahkan, dan isyarat perdagangan dijalankan hanya apabila trend jelas.
- Optimasi parameter penyesuaian diri: Membangunkan mekanisme penyesuaian parameter dinamik yang membolehkan parameter menyesuaikan diri secara automatik mengikut turun naik pasaran.
- Peningkatan mekanisme penangguhan: menetapkan syarat penangguhan berdasarkan ATR atau peratusan tetap, mengawal risiko.
- Menambah pengesahan jumlah transaksi: menggabungkan penunjuk kuantiti transaksi, meningkatkan kebolehpercayaan isyarat.
- Membangunkan penilaian kekuatan isyarat: Menubuhkan sistem penilaian kekuatan isyarat, menyesuaikan saiz kedudukan mengikut kekuatan isyarat yang berbeza.
ringkaskan
Strategi ini membina sistem perdagangan yang agak dipercayai dengan menggabungkan kelebihan RSI dan Stochastic RSI. Walaupun terdapat beberapa batasan, strategi ini mempunyai nilai praktikal yang baik dengan pengurusan risiko yang munasabah dan pengoptimuman berterusan.
- 1