Strategi penjejakan aliran dinamik berbilang penunjuk berdasarkan EMA dan SMA

1
Follow
1781
Followers
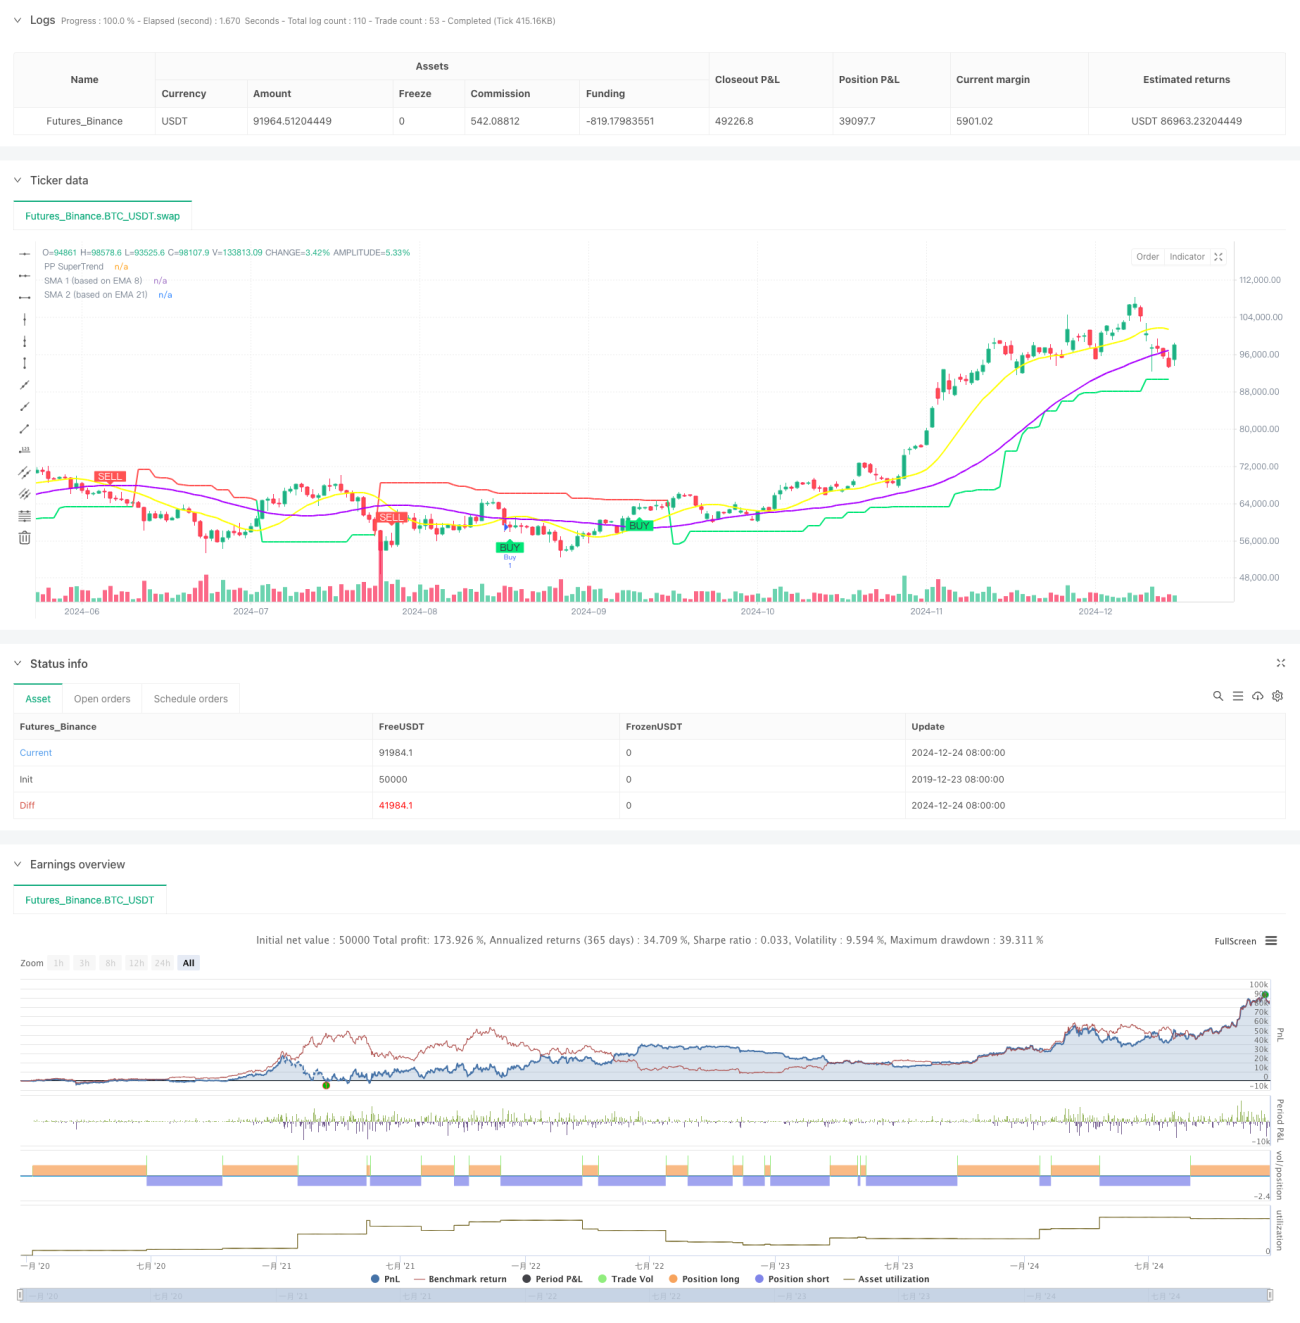
Gambaran Keseluruhan Strategi
Strategi ini adalah sistem pengesanan trend dinamik yang menggabungkan pelbagai petunjuk teknikal. Ia mengenal pasti trend pasaran dan peluang perdagangan dengan mengintegrasikan titik pivot, petunjuk SuperTrend, dan isyarat silang rata-rata bergerak.
Prinsip Strategi
Strategi ini beroperasi berdasarkan mekanisme teras berikut:
- Analisis menggunakan data harga pada tempoh masa yang tetap untuk mengelakkan gangguan yang disebabkan oleh tempoh masa yang berbeza
- Pengiraan SMA melalui EMA 8 kitaran dan kitaran 21 untuk membentuk asas trend
- Indikator SuperTrend yang dikombinasikan dengan ATR dan titik sokongan untuk menentukan arah trend
- Sinyal silang SMA yang muncul dalam tempoh 3 kitaran di titik pangkal dianggap sebagai isyarat yang sah
- Menghitung dan mengesan tahap sokongan / rintangan secara dinamik untuk memberi rujukan kepada keputusan perdagangan
Kelebihan Strategik
- Memperbaiki kebolehpercayaan isyarat melalui cross-validasi pelbagai indikator
- Analisis kitaran masa tetap, mengurangkan gangguan isyarat palsu
- Mekanisme pengesahan titik-titik untuk memastikan transaksi berlaku pada tahap harga kritikal
- Pengesanan dinamik menyokong titik rintangan untuk membantu menentukan kedudukan halangan henti
- Penggunaan penunjuk SuperTrend memberikan pengesahan tambahan mengenai arah trend
- Tetapan parameter yang fleksibel, boleh disesuaikan dengan keadaan pasaran yang berbeza
Risiko Strategik
- Penunjuk berbilang boleh menyebabkan ketinggalan isyarat
- Mungkin terlalu banyak isyarat palsu di pasaran Forex
- Analisis kitaran masa tetap mungkin terlepas isyarat penting untuk kitaran lain
- Mekanisme pengesahan titik-titik boleh menyebabkan kehilangan peluang perdagangan yang penting
- Optimasi parameter yang berlebihan boleh menyebabkan overfitting
Arah pengoptimuman strategi
- Memperkenalkan mekanisme penapisan turun naik untuk mengurangkan kekerapan dagangan semasa turun naik rendah
- Meningkatkan penegasan kekuatan trend seperti ADX atau MACD
- Membangunkan sistem parameter yang menyesuaikan diri, menyesuaikan parameter secara dinamik mengikut keadaan pasaran
- Tambah analisis volum dagangan untuk meningkatkan kebolehpercayaan isyarat
- Mempunyai mekanisme hentian dinamik yang menyesuaikan kedudukan hentian mengikut turun naik pasaran
ringkaskan
Strategi ini membina sistem perdagangan yang mengesan trend yang agak lengkap dengan menggabungkan pelbagai petunjuk teknikal. Kelebihan utamanya adalah meningkatkan kebolehpercayaan isyarat melalui analisis kitaran masa tetap dan pengesahan bit penyokong. Walaupun terdapat risiko ketinggalan tertentu, ia dapat dikawal dengan berkesan melalui pengoptimuman parameter dan langkah-langkah pengurusan risiko.
Source
Pine
Strategy parameters
Related strategies
Comment
All comments (0)
No data
- 1