
Gambaran keseluruhan
Strategi ini ialah sistem perdagangan mengikut arah aliran yang menggabungkan Indeks Kekuatan Relatif (RSI) dan Purata Pergerakan Mudah (SMA). Strategi ini menggunakan purata bergerak untuk menentukan arah aliran pasaran dan menggunakan penunjuk RSI untuk mengesahkan momentum, supaya berdagang apabila arah aliran dan momentum bergema. Strategi ini telah mereka bentuk mekanisme henti untung dan henti rugi yang lengkap, yang boleh mengawal risiko dengan berkesan.
Prinsip Strategi
Logik teras strategi adalah berdasarkan penggunaan gabungan dua petunjuk teknikal:
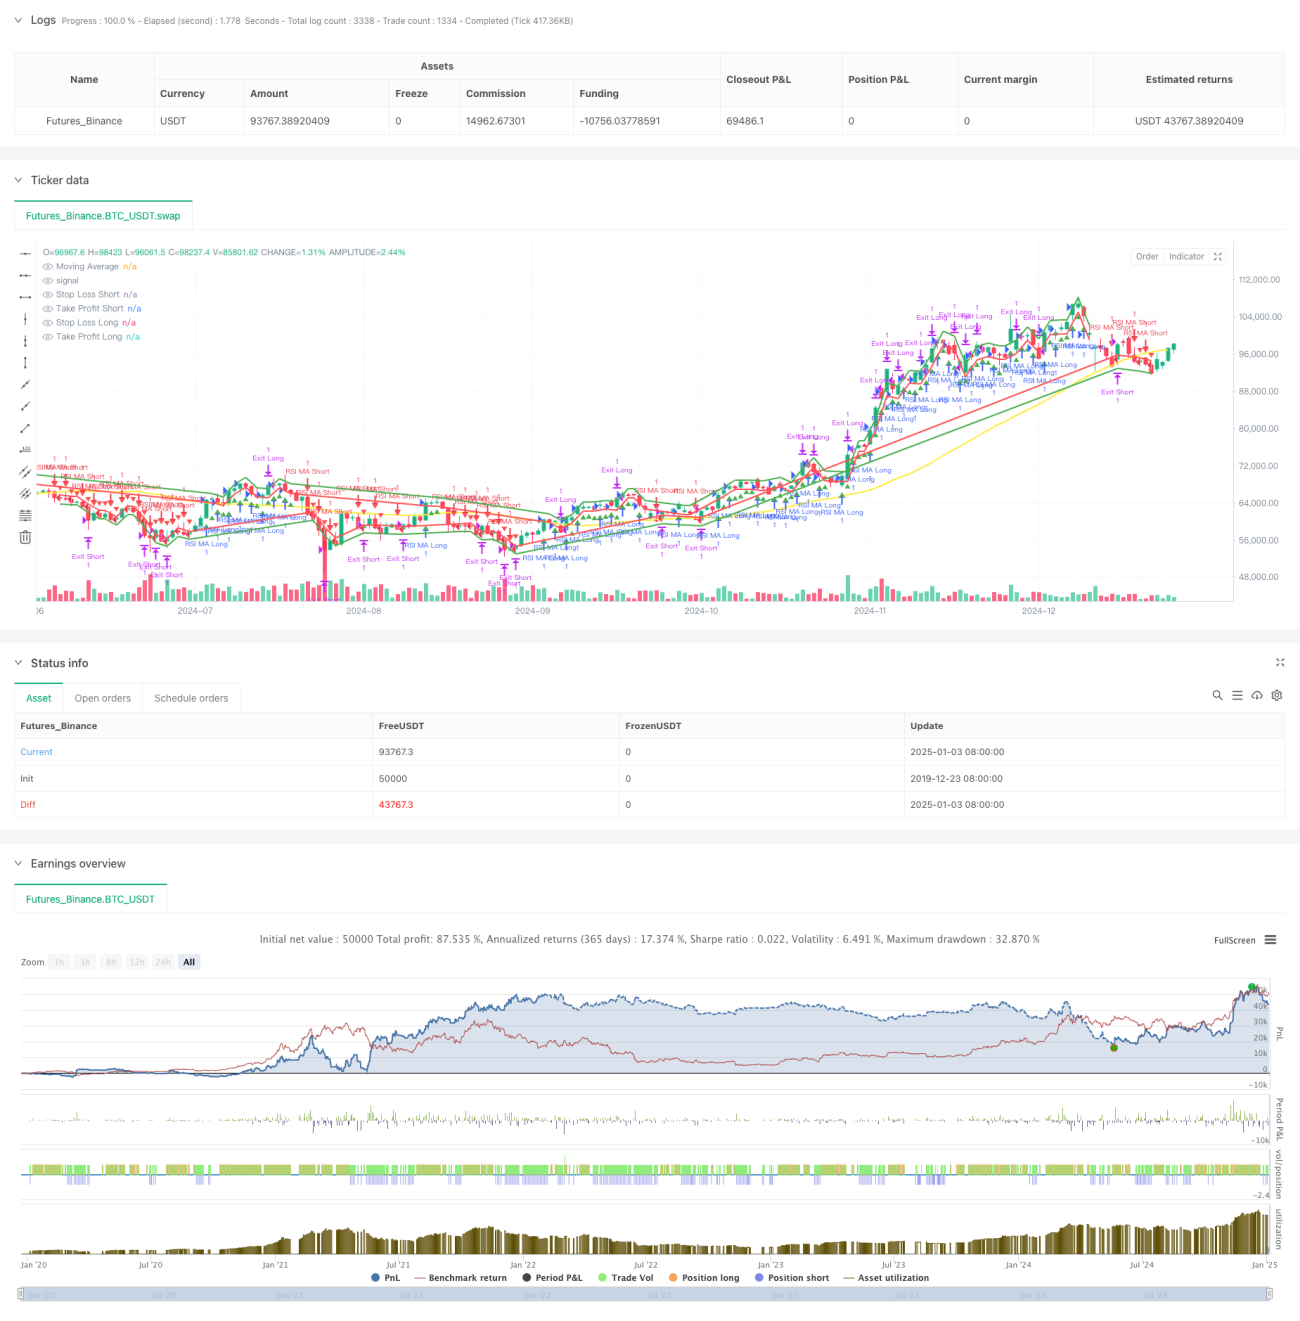
- Purata Pergerakan (MA): Digunakan untuk menentukan arah aliran keseluruhan. Apabila harga berada di atas MA, ia dianggap aliran menaik, jika tidak ia adalah aliran menurun.
- Indeks Kekuatan Relatif (RSI): Digunakan untuk mengesahkan momentum harga. Apabila RSI berada di atas ambang yang ditetapkan (seperti 55), ia mengesahkan momentum menaik, dan apabila ia berada di bawah ambang (seperti 45), ia mengesahkan momentum menurun.
Logik penjanaan isyarat dagangan:
- Keadaan panjang: harga melebihi MA dan RSI lebih besar daripada ambang beli
- Syarat jualan singkat: harga di bawah MA dan RSI kurang daripada ambang jualan
Kawalan risiko menggunakan kaedah peratusan henti rugi dan ambil untung, yang masing-masing ditetapkan sebagai peratusan tetap harga kemasukan.
Kelebihan Strategik
- Kestabilan isyarat: Dengan menggabungkan pengesahan berganda arah aliran dan momentum, isyarat palsu boleh dikurangkan dengan berkesan.
- Pengurusan risiko yang sempurna: peratusan tetap henti rugi dan ambil untung ditetapkan untuk mengawal risiko setiap transaksi dengan berkesan.
- Fleksibiliti parameter: Parameter utama seperti tempoh MA, ambang RSI, dll. boleh dioptimumkan mengikut ciri pasaran yang berbeza.
- Logik strategi adalah jelas: peraturan perdagangan adalah mudah dan intuitif, mudah difahami dan dilaksanakan.
- Kebolehsuaian yang kukuh: boleh digunakan pada urus niaga dalam pelbagai tempoh masa.
Risiko Strategik
- Risiko pembalikan arah aliran: Henti kerugian berterusan mungkin berlaku pada titik perubahan arah aliran.
- Risiko pasaran yang tidak menentu: Dagangan yang kerap boleh menyebabkan kerugian dalam keadaan pasaran terikat julat.
- Pergantungan parameter: Parameter optimum mungkin sangat berbeza dalam persekitaran pasaran yang berbeza.
- Risiko gelinciran: Anda mungkin menghadapi gelinciran besar apabila pasaran turun naik dengan ganas.
- Kelewatan penunjuk teknikal: Kedua-dua MA dan RSI mempunyai kelewatan tertentu, yang boleh menyebabkan kelewatan masa kemasukan.
Arah pengoptimuman strategi
- Pengoptimuman parameter dinamik: Memperkenalkan mekanisme parameter penyesuaian untuk melaraskan tempoh MA dan ambang RSI secara dinamik mengikut turun naik pasaran.
- Penapisan persekitaran pasaran: Tambahkan mekanisme penapisan turun naik untuk melaraskan kedudukan atau menggantung dagangan dalam persekitaran turun naik yang tinggi.
- Analisis tempoh berbilang masa: Memperkenalkan pengesahan arah aliran jangka panjang untuk meningkatkan ketepatan arah dagangan.
- Pengoptimuman henti kerugian: Memperkenalkan mekanisme henti rugi mengekori untuk melindungi keuntungan dengan lebih baik.
- Penapisan isyarat: Tambahkan penunjuk tambahan seperti volum dagangan untuk meningkatkan kebolehpercayaan isyarat.
ringkaskan
Strategi ini menggabungkan penunjuk arah aliran dan momentum untuk membina sistem perdagangan dengan logik yang jelas dan risiko yang boleh dikawal. Walaupun terdapat beberapa risiko yang wujud, strategi ini menunjukkan kepraktisan yang baik melalui penetapan parameter yang munasabah dan kawalan risiko. Arah pengoptimuman seterusnya akan tertumpu terutamanya pada pelarasan parameter dinamik, pengenalpastian persekitaran pasaran dan peningkatan kualiti isyarat, yang dijangka meningkatkan lagi kestabilan dan keuntungan strategi.
- 1