Crossover purata bergerak berbilang digabungkan dengan sokongan Camarilla dan sistem perdagangan trend rintangan

Gambaran keseluruhan
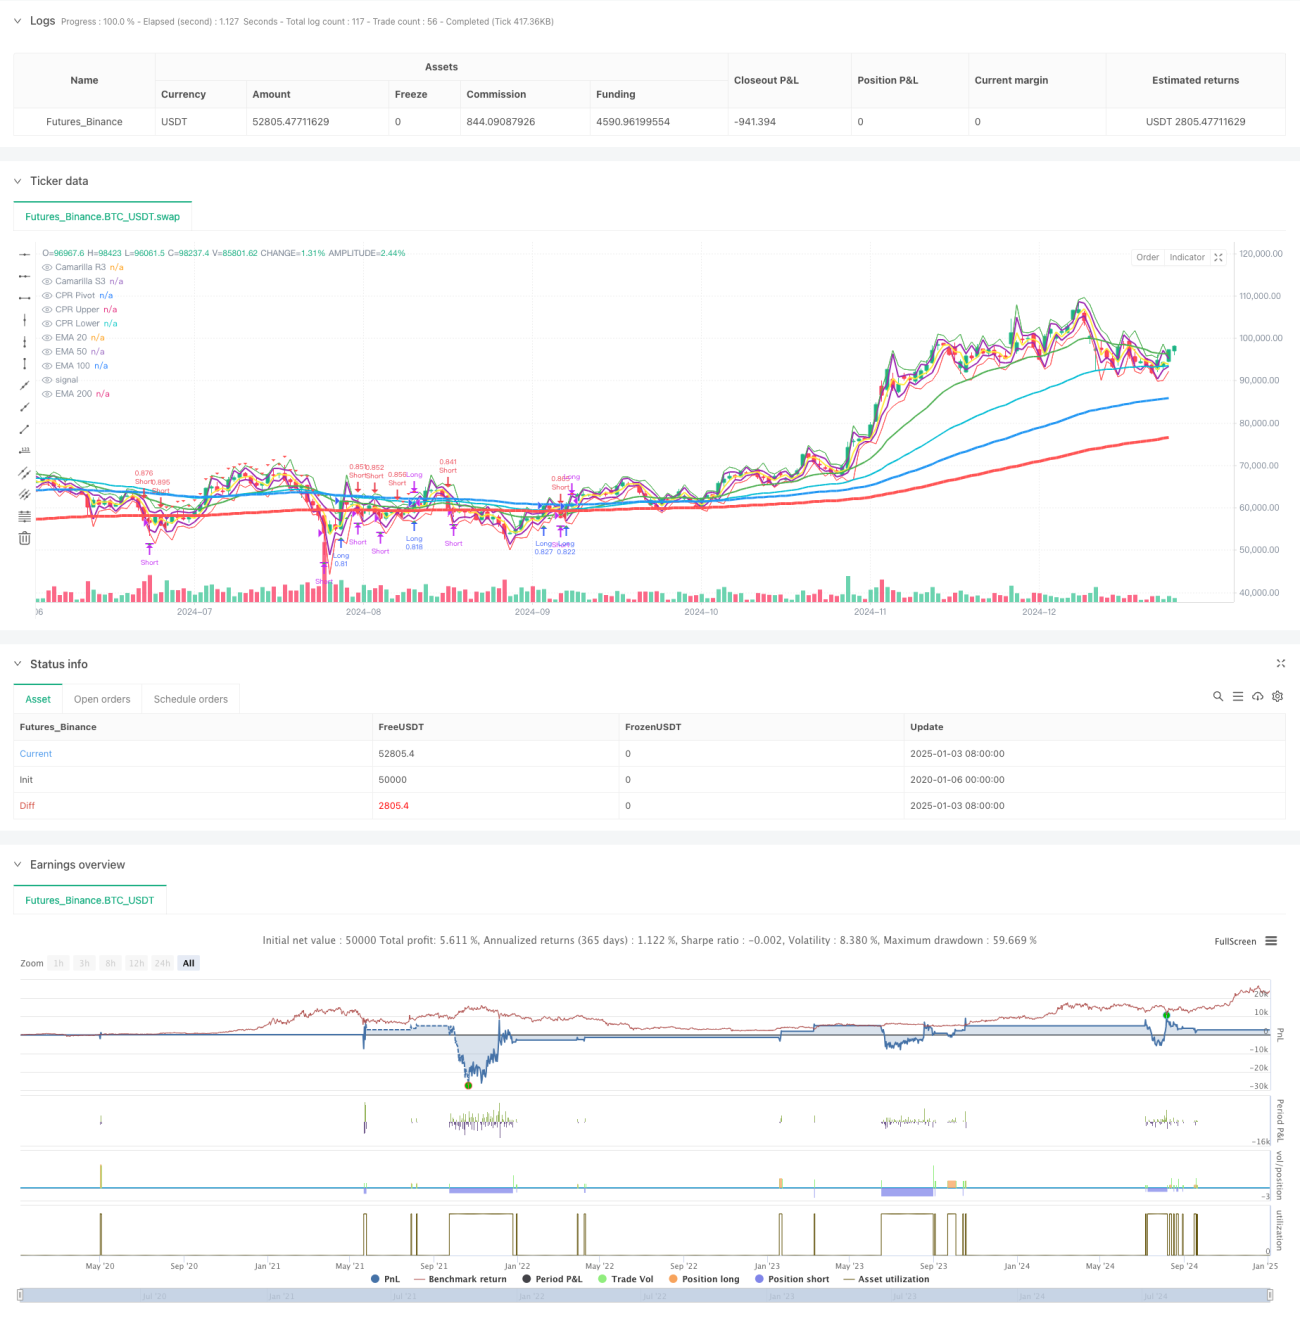
Strategi ini ialah sistem perdagangan mengikut aliran yang menggabungkan berbilang purata bergerak eksponen (EMA), tahap sokongan dan rintangan Camarilla, dan Julat Pivotal Pusat (CPR). Strategi ini mengenal pasti arah aliran pasaran dan peluang dagangan yang berpotensi dengan menganalisis harga berhubung dengan berbilang purata bergerak dan julat harga yang penting. Sistem ini mengamalkan pengurusan dana yang ketat dan langkah kawalan risiko, termasuk saiz peratusan kedudukan dan mekanisme keluar yang pelbagai.
Prinsip Strategi
Strategi ini berdasarkan komponen teras berikut:
- Sistem purata bergerak berbilang (EMA20/50/100/200) digunakan untuk mengesahkan arah aliran dan kekuatan
- Tahap sokongan dan rintangan Camarilla (R3/S3) digunakan untuk mengenal pasti tahap harga utama
- Julat Harga Pusat (CPR) digunakan untuk menentukan julat dagangan dalam sehari.
- Isyarat kemasukan adalah berdasarkan persilangan harga dengan EMA200 dan pengesahan oleh EMA20
- Strategi keluar termasuk mata tetap dan mod pergerakan peratusan
- Sistem pengurusan dana secara dinamik melaraskan saiz kedudukan mengikut saiz akaun
Kelebihan Strategik
- Gabungan penunjuk teknikal berbilang dimensi menyediakan isyarat dagangan yang lebih dipercayai
- Mekanisme keluar yang fleksibel untuk menyesuaikan diri dengan persekitaran pasaran yang berbeza
- Sistem pengurusan dana yang sempurna mengawal risiko dengan berkesan
- Ciri mengikut aliran membantu menangkap pergerakan besar
- Komponen visualisasi memudahkan pedagang memahami struktur pasaran
Risiko Strategik
- Isyarat palsu mungkin berlaku dalam pasaran yang tidak menentu
- Penunjuk berbilang boleh menyebabkan isyarat dagangan tertunda
- Titik keluar tetap mungkin tidak berprestasi baik dalam pasaran yang tidak menentu
- Saiz dana yang lebih besar diperlukan untuk menahan pengeluaran
- Kos urus niaga boleh menjejaskan pulangan keseluruhan strategi
Arah pengoptimuman strategi
- Memperkenalkan penunjuk turun naik untuk melaraskan parameter masuk dan keluar secara dinamik
- Tambah modul pengecaman status pasaran untuk menyesuaikan diri dengan persekitaran pasaran yang berbeza
- Optimumkan sistem pengurusan dana dan tambah pengurusan kedudukan yang dinamik
- Penapis masa dagangan ditambah untuk meningkatkan kualiti isyarat
- Pertimbangkan untuk menambah analisis volum untuk meningkatkan kebolehpercayaan isyarat
ringkaskan
Strategi ini membina sistem perdagangan yang lengkap dengan menyepadukan berbilang alat analisis teknikal klasik. Kelebihan sistem terletak pada analisis pasaran berbilang dimensi dan pengurusan risiko yang ketat, tetapi ia juga perlu memberi perhatian kepada kebolehsuaiannya kepada persekitaran pasaran yang berbeza. Melalui pengoptimuman dan penambahbaikan berterusan, strategi ini dijangka meningkatkan keuntungan sambil mengekalkan kestabilan.
- 1