Aliran jangka panjang strategi kuantitatif persilangan purata SMA bergerak

Gambaran keseluruhan
Strategi ini adalah sistem perdagangan kuantitatif berdasarkan isyarat silang berbilang tempoh purata bergerak mudah (SMA). Ia terutamanya berdagang dengan mengenal pasti peluang penarikan balik jangka pendek dalam aliran menaik jangka panjang. Strategi ini menggunakan penunjuk SMA dengan lima tempoh 5 hari, 10 hari, 20 hari, 60 hari dan 120 hari untuk menilai arah aliran pasaran dan peluang dagangan melalui hubungan kedudukan dan isyarat silang bagi purata bergerak.
Prinsip Strategi
Logik teras strategi merangkumi bahagian penting berikut:
- Aliran jangka panjang boleh dinilai oleh hubungan kedudukan relatif antara SMA20 dan SMA60 Apabila SMA20 berada di atas SMA60, ia disahkan bahawa pasaran berada dalam aliran menaik.
- Pada premis untuk mengesahkan aliran menaik jangka panjang, isyarat beli dicetuskan apabila SMA5 jangka pendek melantun dari bawah SMA20 ke atas. Ini menunjukkan bahawa pasaran melantun semula selepas penarikan balik jangka pendek dalam aliran menaik.
- Apabila SMA20 melintasi SMA5, isyarat penutupan dicetuskan. Ini menunjukkan bahawa momentum menaik jangka pendek telah lemah dan mungkin memasuki tempoh pelarasan.
- Strategi ini juga termasuk fungsi penapis masa, yang boleh mengehadkan julat masa ujian belakang dan meningkatkan fleksibiliti strategi.
Kelebihan Strategik
- Logik strategi adalah jelas dan mudah, mudah difahami dan dilaksanakan, serta tidak melibatkan proses pengiraan yang rumit.
- Dengan menggunakan purata pergerakan berbilang tempoh dalam penyelarasan, kami boleh menapis bunyi pasaran dengan berkesan dan meningkatkan kebolehpercayaan isyarat dagangan.
- Strategi ini memberi tumpuan kepada peluang penarikan balik dalam pasaran trend, yang selaras dengan konsep teras "trading trend".
- Menggunakan SMA dan bukannya EMA mengurangkan sensitiviti kepada perubahan harga dan mengurangkan isyarat palsu.
- Logik masuk dan keluar adalah jelas, yang memudahkan pelaksanaan dan kawalan risiko.
Risiko Strategik
- Sistem purata bergerak mempunyai ketinggalan, yang boleh membawa kepada masa masuk dan keluar yang tidak optimum.
- Dalam pasaran yang tidak menentu, persilangan purata bergerak yang kerap boleh menghasilkan terlalu banyak isyarat palsu.
- Strategi ini tidak mempunyai mekanisme penapisan turun naik dan mungkin menghadapi risiko pengeluaran yang lebih besar semasa tempoh turun naik yang tinggi.
- Tanpa mengambil kira kerjasama penunjuk teknikal lain seperti volum dagangan, kebolehpercayaan isyarat perlu dipertingkatkan.
- Parameter purata bergerak tetap mungkin tidak sesuai untuk semua persekitaran pasaran.
Arah pengoptimuman strategi
- Memperkenalkan penunjuk ATR untuk penapisan turun naik dan elakkan dagangan apabila turun naik terlalu tinggi.
- Tambah mekanisme pengesahan volum untuk meningkatkan kebolehpercayaan isyarat dagangan.
- Membangunkan mekanisme kitaran purata bergerak adaptif untuk membolehkan strategi menyesuaikan diri dengan lebih baik kepada persekitaran pasaran yang berbeza.
- Tambahkan penapis kekuatan arah aliran, seperti penunjuk ADX, untuk memastikan dagangan dalam arah aliran yang kukuh.
- Tingkatkan mekanisme henti rugi, seperti menambah hentian mengekor, untuk mengawal risiko dengan lebih baik.
ringkaskan
Strategi ini menggunakan purata bergerak SMA berbilang tempoh untuk membina sistem perdagangan yang memfokuskan pada menangkap peluang penarikan balik dalam arah aliran menaik jangka panjang. Reka bentuk strategi adalah ringkas dan praktikal, dengan kebolehfahaman dan kebolehlaksanaan yang baik. Dengan memperkenalkan langkah pengoptimuman seperti penapisan turun naik dan pengesahan volum, keteguhan dan kebolehpercayaan strategi dijangka akan dipertingkatkan lagi.
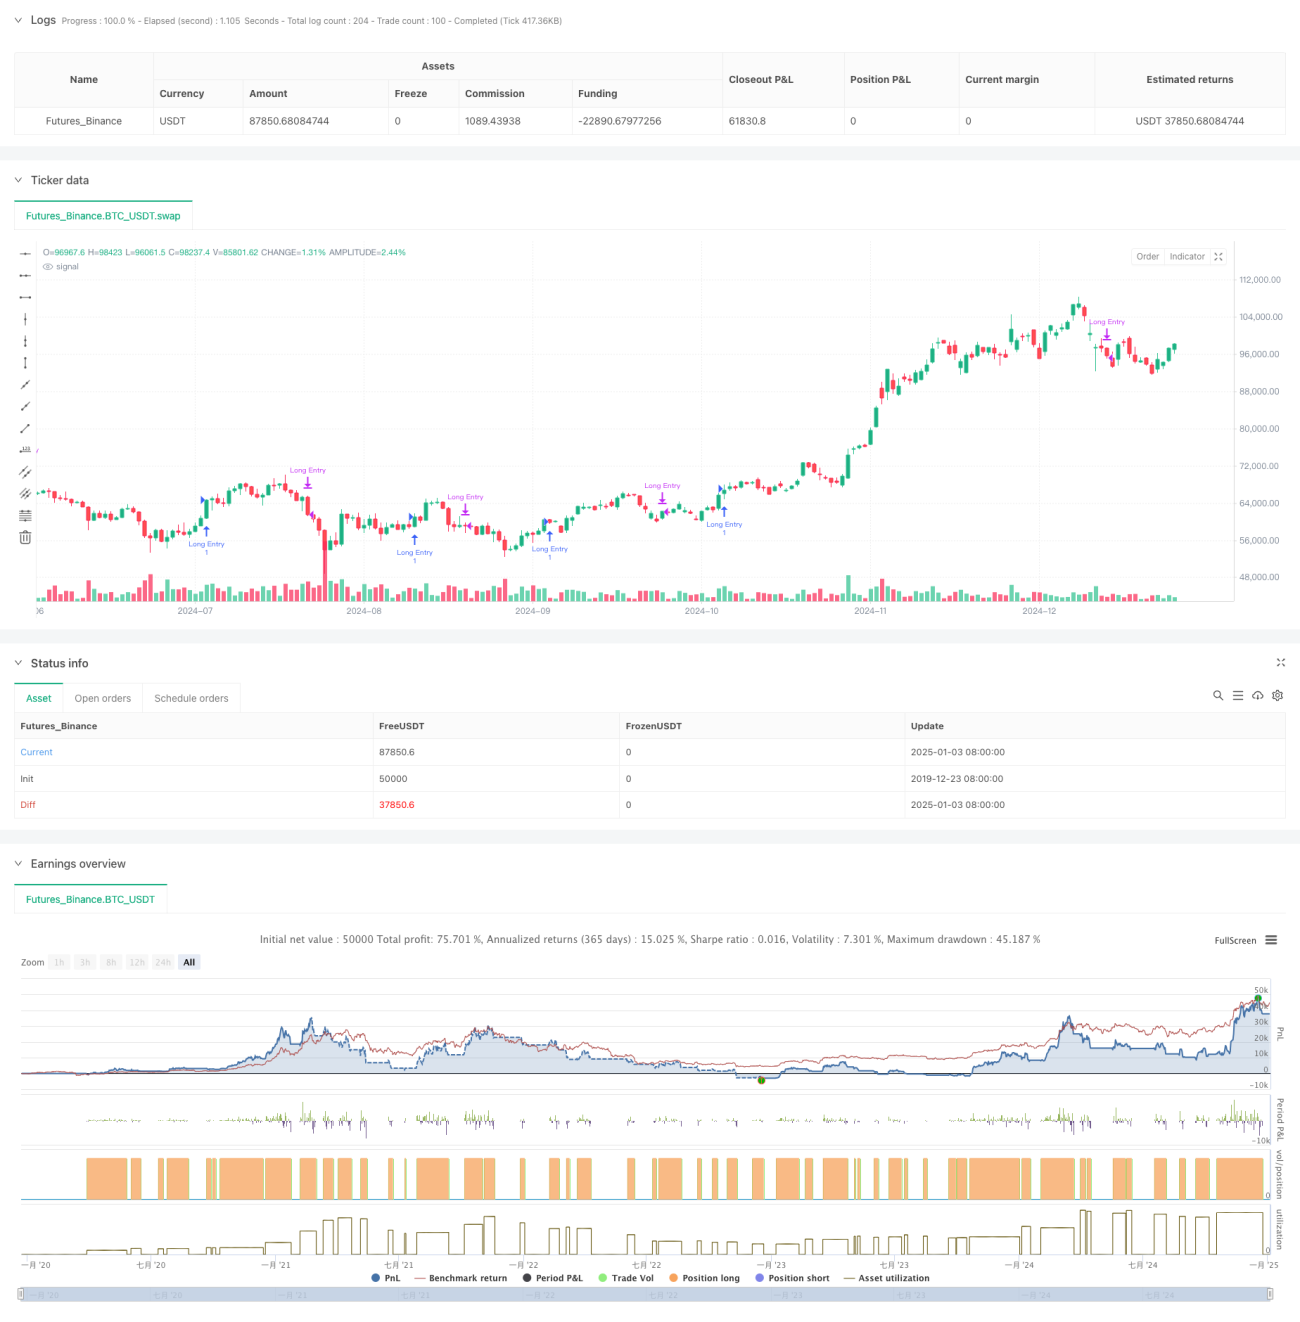
/*backtest
start: 2019-12-23 08:00:00
end: 2025-01-04 08:00:00
period: 1d
basePeriod: 1d
exchanges: [{"eid":"Futures_Binance","currency":"BTC_USDT"}]
*/

//@version=6
strategy("Long-Term Growing Stock Strategy", overlay=true)
// Date Range
// STEP 1. Create inputs that configure the backtest's date range- 1