Penjejakan arah aliran harga dan volum frekuensi tinggi dan strategi penyesuaian volum

Gambaran keseluruhan
Strategi ini ialah sistem perdagangan automatik berdasarkan jangka masa 5 minit yang menggabungkan kaedah analisis aliran purata bergerak dan kaedah analisis volum. Strategi ini menggunakan purata bergerak mudah (SMA) 50 tempoh untuk menentukan arah aliran pasaran dan memperkenalkan analisis volum untuk mengesahkan kesahihan isyarat dagangan. Sistem ini menggunakan sasaran henti rugi dan keuntungan tetap untuk mencapai dagangan automatik sepenuhnya.
Prinsip Strategi
Logik teras strategi merangkumi komponen utama berikut:
- Pengenalpastian arah aliran: Gunakan SMA 50-tempoh untuk menentukan arah pasaran Apabila harga penutup lebih tinggi daripada purata bergerak, ia dianggap aliran menaik, jika tidak, ia adalah arah aliran menurun. Pada masa yang sama, trend harga dalam 30 minit yang lalu (6 K-lines) digabungkan untuk mengesahkan trend.
- Analisis volum: Kira volum belian dan jualan berdasarkan turun naik harga, dan peruntukkan volum dalam setiap K-line ke dalam volum belian dan volum jualan mengikut kedudukan harga penutup.
- Penjanaan isyarat dagangan: Dalam aliran menaik, isyarat panjang dijana apabila volum belian lebih besar daripada volum jualan dalam aliran menurun, isyarat pendek dijana apabila volum jualan lebih besar daripada volum belian.
- Kawalan Risiko: Gunakan 3% stop loss dan sasaran keuntungan 29% untuk menguruskan nisbah risiko-ganjaran bagi setiap perdagangan.
Kelebihan Strategik
- Pengesahan arah aliran berbilang dimensi: Dengan menggabungkan purata bergerak dan arah aliran harga jangka pendek untuk mengesahkan aliran dua kali ganda, ketepatan pertimbangan arah aliran dipertingkatkan.
- Pengesahan Volume: Memperkenalkan analisis volum sebagai penapis isyarat dagangan untuk mengelakkan pecahan palsu dalam persekitaran volum rendah.
- Pengurusan risiko yang sempurna: tetapkan sasaran henti rugi dan keuntungan yang jelas untuk mengawal risiko satu transaksi dengan berkesan.
- Kebolehsuaian yang kukuh: Strategi boleh melaraskan arah urus niaga secara automatik mengikut status pasaran dan menyesuaikan diri dengan persekitaran pasaran yang berbeza.
Risiko Strategik
- Risiko pasaran tidak menentu: Isyarat pelarian palsu yang kerap mungkin berlaku dalam pasaran sisi dan tidak menentu, yang membawa kepada henti kerugian berterusan.
- Risiko gelincir: Dalam perdagangan frekuensi tinggi, anda mungkin menghadapi gelinciran besar, yang akan menjejaskan kesan pelaksanaan sebenar.
- Kepekaan parameter: Kesan strategi adalah sensitif kepada parameter seperti tempoh purata bergerak dan tempoh pengiraan volum dagangan.
- Pergantungan pada persekitaran pasaran: Strategi ini berprestasi baik dalam pasaran dengan arah aliran yang jelas, tetapi mungkin mengalami pengeluaran besar semasa tempoh peralihan arah aliran.
Arah pengoptimuman strategi
- Pengoptimuman parameter dinamik: Mekanisme parameter penyesuaian boleh diperkenalkan untuk melaraskan secara dinamik tempoh purata bergerak dan tempoh pengiraan volum dagangan mengikut turun naik pasaran.
- Tingkatkan penapisan persekitaran pasaran: Tambahkan penunjuk turun naik atau petunjuk kekuatan arah aliran untuk menghentikan dagangan secara automatik dalam keadaan pasaran yang tidak sesuai.
- Tingkatkan mekanisme henti rugi: Henti rugi dinamik, seperti henti rugi mengekor atau henti rugi berasaskan ATR, boleh digunakan untuk meningkatkan fleksibiliti kawalan risiko.
- Optimumkan logik penjanaan isyarat: Pertimbangkan untuk menambah lebih banyak penunjuk teknikal untuk pengesahan silang bagi meningkatkan kebolehpercayaan isyarat.
ringkaskan
Strategi ini membina sistem perdagangan frekuensi tinggi yang lengkap dengan menggabungkan penjejakan arah aliran dan analisis volum. Kelebihan utama strategi ini terletak pada mekanisme pengesahan isyarat berbilang dimensi dan sistem kawalan risiko yang sempurna. Walaupun terdapat beberapa risiko yang wujud, kestabilan dan kebolehsesuaian strategi boleh dipertingkatkan lagi melalui arahan pengoptimuman yang dicadangkan. Strategi ini amat sesuai untuk beroperasi dalam persekitaran pasaran dengan arah aliran yang jelas, dan dijangka mencapai hasil dagangan yang stabil melalui pengoptimuman parameter yang munasabah dan pengurusan risiko.
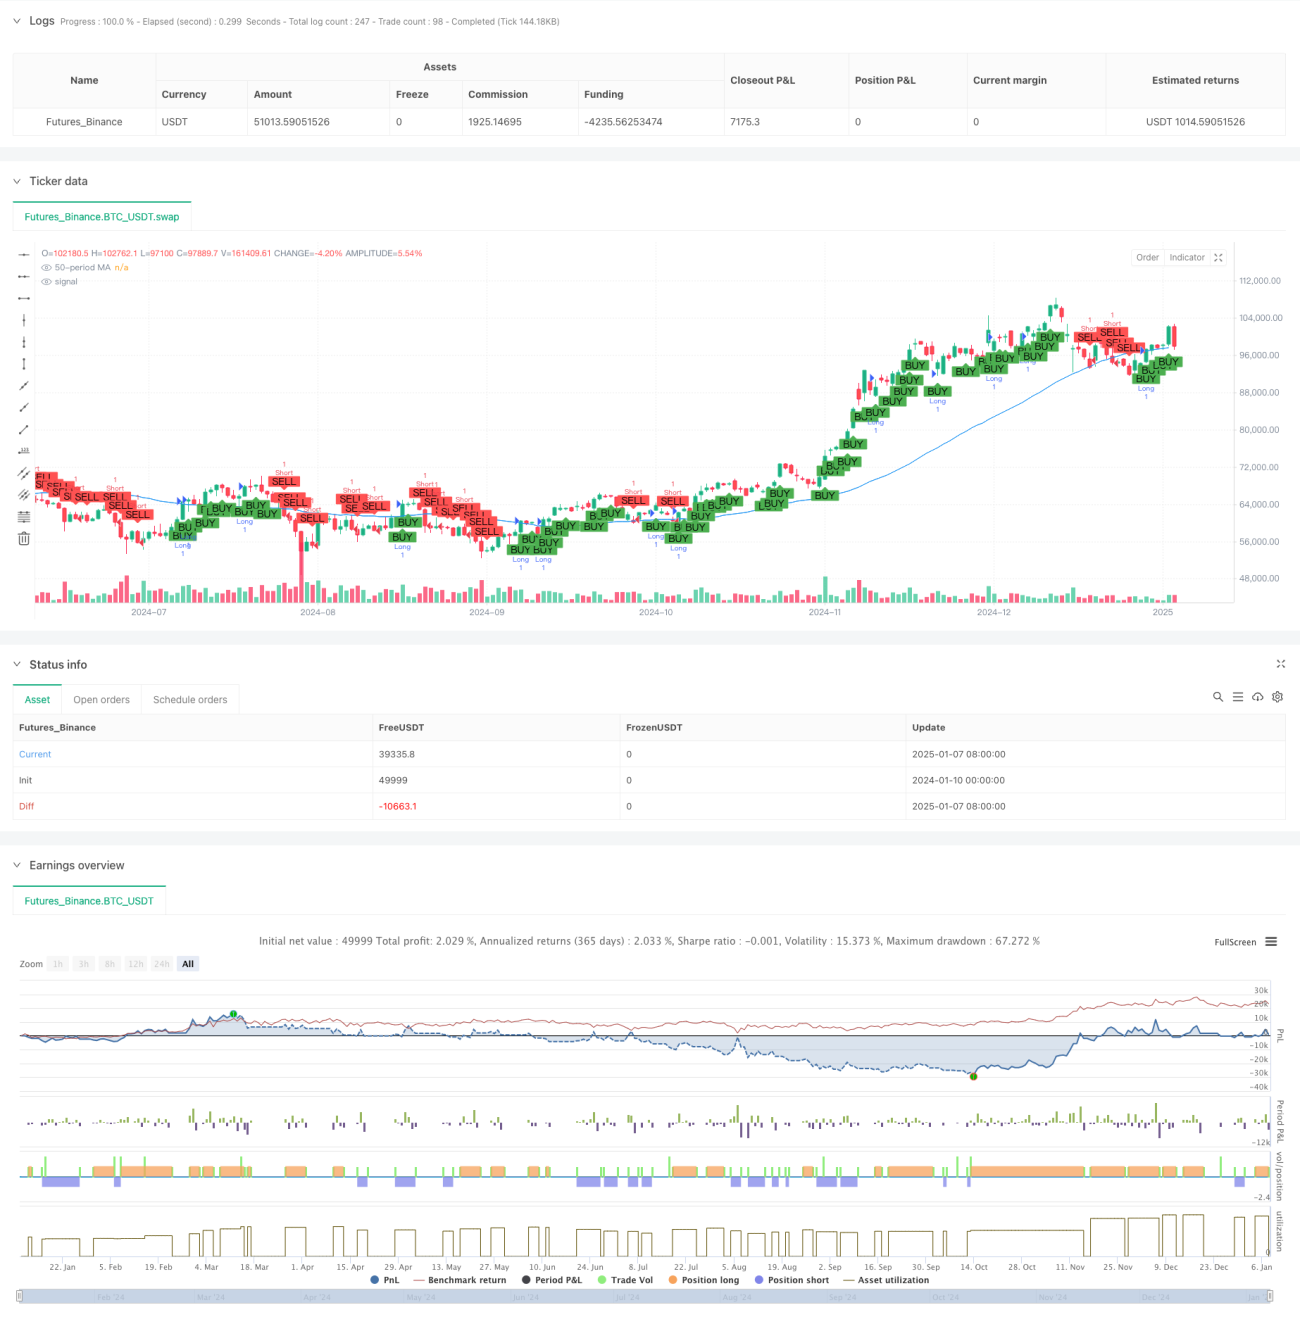
/*backtest
start: 2024-01-10 00:00:00
end: 2025-01-08 08:00:00
period: 1d
basePeriod: 1d
exchanges: [{"eid":"Futures_Binance","currency":"BTC_USDT","balance":49999}]
*/

// This Pine Script™ code is subject to the terms of the Mozilla Public License 2.0 at https://mozilla.org/MPL/2.0/
// © Jerryorange

//@version=6- 1