Penjejakan aliran purata bergerak berbilang dan strategi penapisan turun naik dinamik

Gambaran keseluruhan
Strategi ini adalah sistem perdagangan pintar yang menggabungkan mengikut aliran dan penapisan turun naik. Ia mengenal pasti arah aliran pasaran melalui Purata Pergerakan Eksponen (EMA), menggunakan Julat Benar (TR) dan penapis turun naik dinamik untuk menentukan masa kemasukan, dan menguruskan risiko dengan mekanisme henti untung dan henti rugi dinamik berdasarkan turun naik. Strategi ini menyokong dua mod dagangan: Scalp dan Swing, yang boleh ditukar secara fleksibel mengikut persekitaran pasaran dan gaya dagangan yang berbeza.
Prinsip Strategi
Logik teras strategi merangkumi komponen utama berikut:
- Pengenalpastian Aliran: Gunakan EMA 50-tempoh sebagai penapis arah aliran dan hanya beli apabila harga di atas EMA dan turun apabila harga di bawah EMA.
- Penapisan Kemeruapan: Mengira EMA Julat Benar (TR) dan menggunakan faktor penapis boleh laras (lalai 1.5) untuk menapis bunyi pasaran.
- Syarat kemasukan: Digabungkan dengan analisis morfologi tiga garisan K berturut-turut, pergerakan harga mestilah berterusan dan dipercepatkan.
- Ambil Untung dan Henti Rugi: Dalam mod jangka pendek, ia ditetapkan berdasarkan TR semasa dalam mod jalur, ia ditetapkan berdasarkan mata tinggi dan rendah sebelumnya untuk mencapai pengurusan risiko dinamik.
Kelebihan Strategik
- Kebolehsuaian yang kukuh: Melalui gabungan penapisan turun naik dinamik dan penjejakan arah aliran, ia boleh menyesuaikan diri dengan persekitaran pasaran yang berbeza.
- Pengurusan risiko yang sempurna: Menyediakan mekanisme henti untung dan henti rugi dinamik untuk dua mod dagangan, yang boleh dipilih secara fleksibel mengikut ciri pasaran.
- Kebolehlarasan parameter yang baik: parameter utama seperti pekali penapis, kitaran arah aliran, dll. boleh dioptimumkan mengikut ciri produk dagangan.
- Kesan visualisasi yang baik: Menyediakan tanda isyarat beli dan jual yang jelas dan paparan kedudukan henti untung dan henti rugi untuk memudahkan pemantauan transaksi.
Risiko Strategik
- Risiko pembalikan arah aliran: hentian berturut-turut mungkin berlaku pada titik perubahan arah aliran.
- Risiko pecahan palsu: Isyarat palsu mungkin dicetuskan apabila turun naik tiba-tiba meningkat.
- Kepekaan parameter: Tetapan pekali penapis yang tidak betul boleh mengakibatkan isyarat terlalu banyak atau terlalu sedikit.
- Impak gelinciran: Dalam pasaran yang pantas, anda mungkin menghadapi gelinciran yang besar, yang mungkin menjejaskan prestasi strategi anda.
Arah pengoptimuman strategi
- Tambahkan penapisan kekuatan aliran: Penunjuk seperti ADX boleh diperkenalkan untuk menilai kekuatan aliran dan meningkatkan kesan penjejakan arah aliran.
- Optimumkan ambil untung dan henti rugi: Pertimbangkan untuk memperkenalkan henti rugi bergerak untuk melindungi lebih banyak keuntungan.
- Tingkatkan model dagangan ayunan: lebih banyak syarat pertimbangan perdagangan ayunan boleh ditambah untuk meningkatkan keupayaan pegangan jangka sederhana dan panjang.
- Tambah analisis volum: Gabungkan perubahan volum untuk mengesahkan kesahihan kejayaan.
ringkaskan
Strategi ini membina sistem perdagangan yang lengkap dengan menggabungkan secara organik penjejakan arah aliran, penapisan turun naik dan pengurusan risiko dinamik. Kelebihan strategi ialah ia sangat mudah disesuaikan dan dikawal risiko, sambil menyediakan ruang yang besar untuk pengoptimuman. Dengan menetapkan parameter secara munasabah dan memilih mod dagangan yang sesuai, strategi boleh mengekalkan prestasi yang stabil dalam persekitaran pasaran yang berbeza. Adalah disyorkan bahawa pedagang menjalankan ujian belakang yang mencukupi dan pengoptimuman parameter sebelum penggunaan sebenar, dan membuat pelarasan yang sepadan berdasarkan ciri-ciri produk dagangan tertentu.
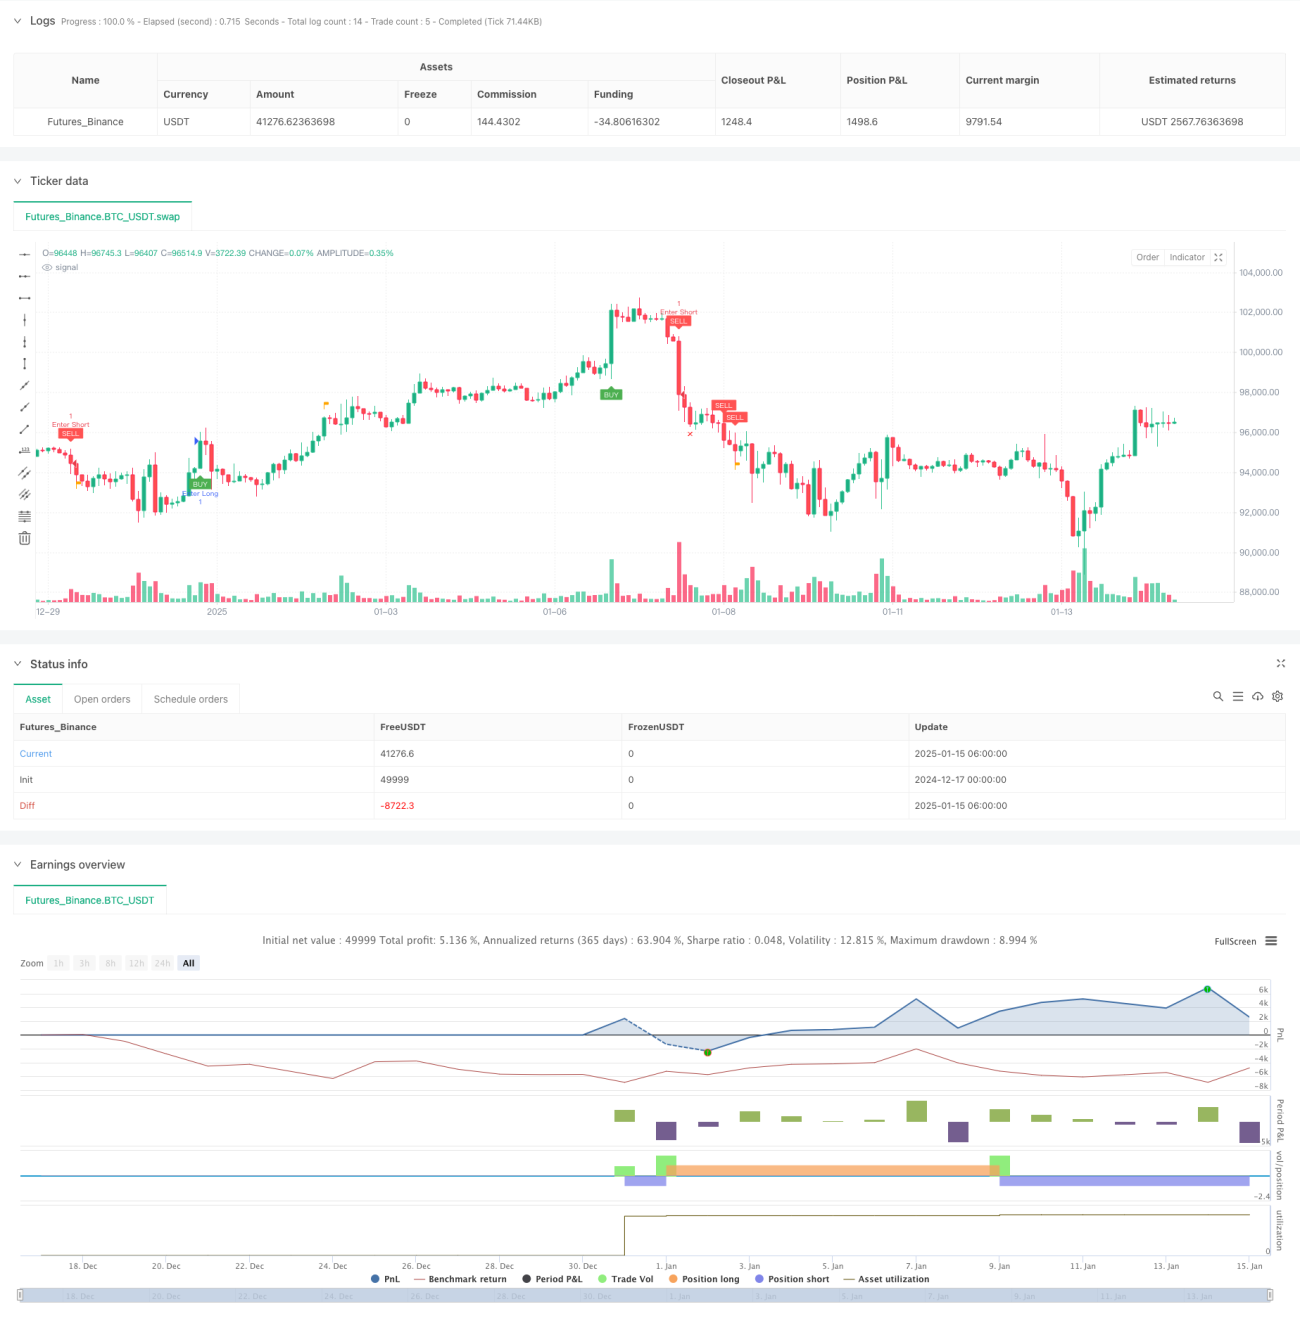
/*backtest
start: 2024-12-17 00:00:00
end: 2025-01-15 08:00:00
period: 2h
basePeriod: 2h
exchanges: [{"eid":"Futures_Binance","currency":"BTC_USDT","balance":49999}]
*/

// This Pine Script™ code is subject to the terms of the Mozilla Public License 2.0 at https://mozilla.org/MPL/2.0/
// © Creativ3mindz

//@version=5- 1