
Gambaran Keseluruhan
Ini adalah strategi perdagangan kuantitatif yang menggabungkan Indeks Kekuatan Relatif (RSI) dengan pelbagai jenis purata bergerak. Strategi ini terutamanya menilai arah aliran pasaran dengan memantau isyarat persilangan pelbagai jenis purata bergerak (termasuk SMA, EMA, WMA dan SMMA) pada penunjuk RSI, sambil menggunakan zon terlebih beli dan terlebih jual pada penunjuk RSI itu sendiri sebagai rujukan tambahan untuk menentukan masa perdagangan.
Prinsip Strategi
Strategi ini merangkumi beberapa langkah pengiraan utama berikut:
- Kira penunjuk RSI untuk tempoh 14 kitaran, tetapkan zon terlebih beli pada 70 dan zon terlebih jual pada 30.
- Pada lengkung RSI, hitung 3 garis purata bergerak dengan parameter yang berbeza:
- MA1: 20 kitaran, boleh pilih SMA/EMA/WMA/SMMA
- MA2: 50 kitaran, boleh pilih SMA/EMA/WMA/SMMA
- MA3: 100 kitaran, boleh pilih SMA/EMA/WMA/SMMA
- Peraturan penjanaan isyarat dagangan:
- Isyarat beli: Apabila MA2 menembusi ke atas MA3
- Isyarat jual: Apabila MA2 menembusi ke bawah MA3
- Pada masa yang sama, mengesan perbezaan (divergence) pada penunjuk RSI untuk memberikan rujukan tambahan bagi keputusan perdagangan.
Kelebihan Strategi
- Pengesahan silang pelbagai penunjuk teknikal meningkatkan kebolehpercayaan isyarat perdagangan.
- Jenis dan parameter purata bergerak boleh dilaraskan, memberikan fleksibiliti yang tinggi.
- Fungsi pengesanan perbezaan RSI dapat membantu mengesan titik perubahan pasaran lebih awal.
- Menggunakan pengurusan saiz kedudukan berdasarkan peratusan, mengawal risiko dengan berkesan.
- Visualisasi yang sangat baik, memudahkan analisis dan ujian semula.
Risiko Strategi
- Persilangan purata bergerak mungkin menghasilkan kesan ketinggalan (lag effect).
- Dalam pasaran yang mendatar dan tidak menentu, ia mungkin menghasilkan banyak isyarat palsu.
- Penunjuk RSI mungkin tidak tepat dalam keadaan pasaran tertentu.
- Pemilihan parameter yang tidak sesuai boleh menyebabkan terlalu banyak atau terlalu sedikit isyarat dagangan.
Langkah pengelakan:
- Disyorkan untuk melakukan pengesahan silang dengan arah aliran pasaran dan volum dagangan.
- Frekuensi dagangan boleh dioptimumkan dengan melaraskan parameter purata bergerak.
- Tetapkan henti rugi dan ambil untung untuk mengawal risiko.
Arah Pengoptimuman Strategi
- Pengoptimuman penapisan isyarat:
- Menambah penunjuk pengesahan arah aliran
- Menambah analisis volum
- Pengoptimuman parameter dinamik:
- Melaraskan parameter RSI dan MA secara automatik berdasarkan turun naik pasaran
- Memperkenalkan kaedah pengiraan kitaran adaptif
- Pengoptimuman kawalan risiko:
- Membangunkan mekanisme henti rugi dan ambil untung dinamik
- Merancang sistem pengurusan saiz kedudukan dinamik
Kesimpulan
Strategi ini membina sistem perdagangan yang mempunyai kebolehsuaian tinggi dengan menggabungkan RSI dan pelbagai purata bergerak. Kelebihan utama strategi terletak pada pengesahan silang pelbagai penunjuk teknikal dan konfigurasi parameter yang fleksibel, tetapi perlu diberi perhatian terhadap kesan ketinggalan purata bergerak serta pengaruh keadaan pasaran terhadap prestasi strategi. Melalui pengoptimuman berterusan dan kawalan risiko, strategi ini berpotensi mencapai prestasi yang stabil dalam perdagangan sebenar.
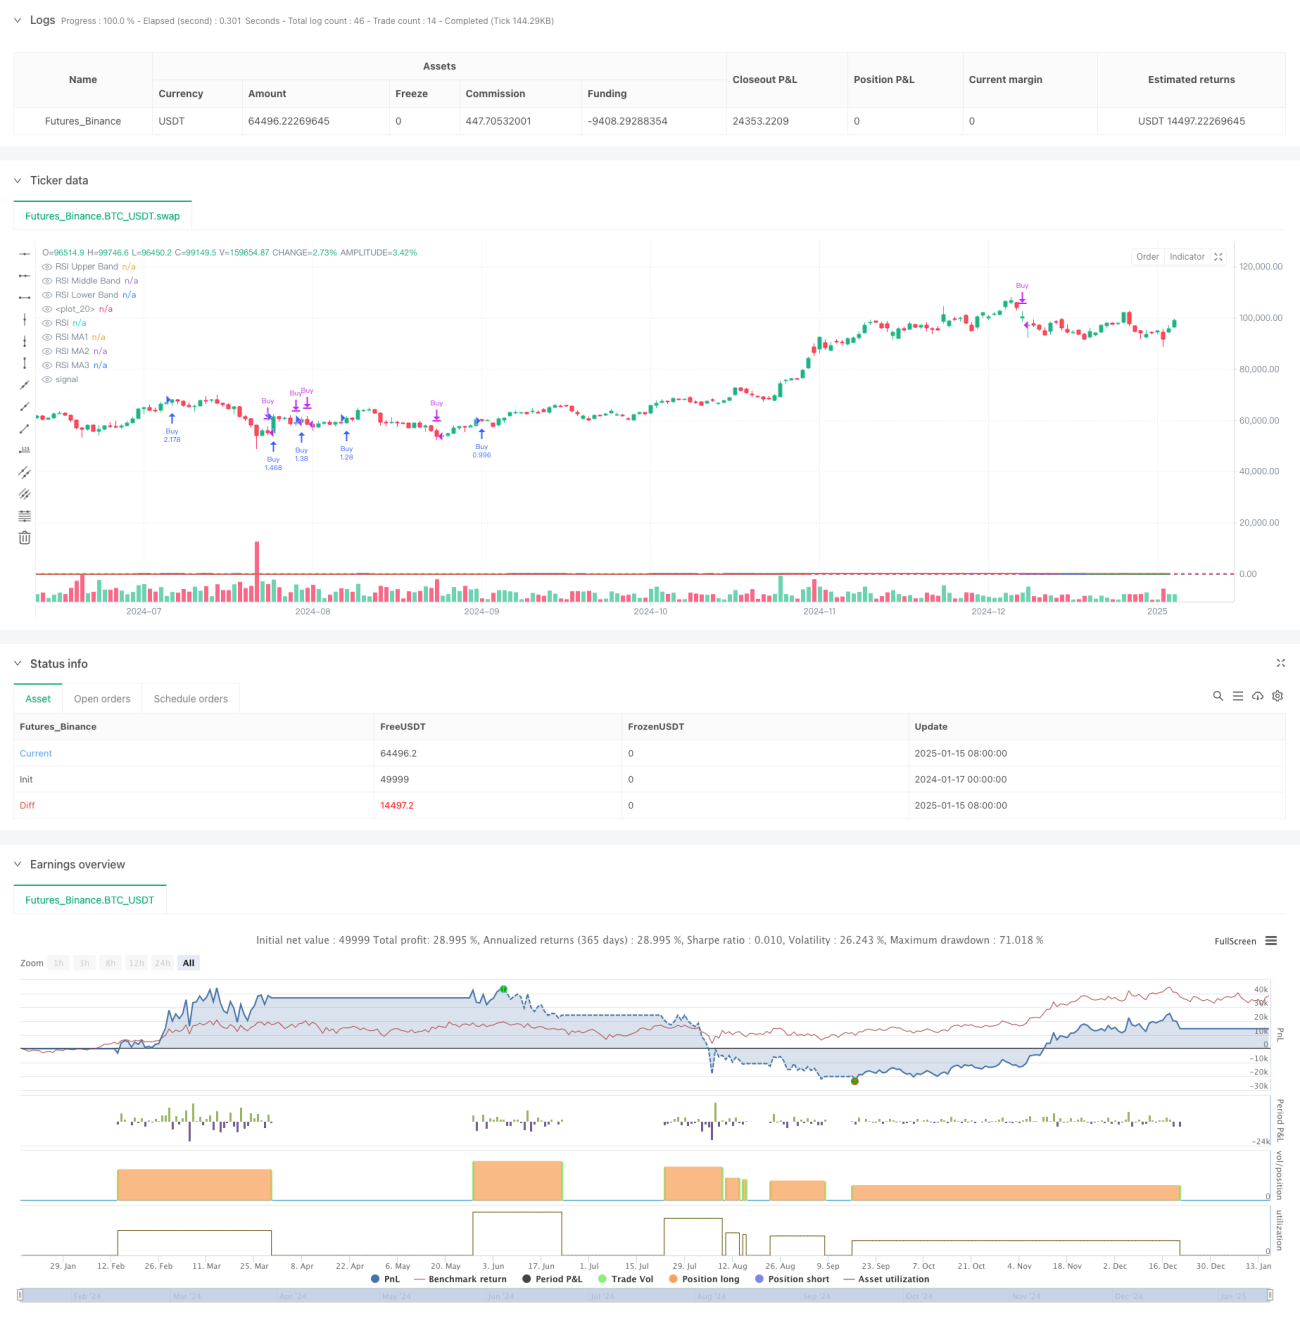
/*backtest
start: 2024-01-17 00:00:00
end: 2025-01-16 00:00:00
period: 1d
basePeriod: 1d
exchanges: [{"eid":"Futures_Binance","currency":"BTC_USDT","balance":49999}]
*/

//@version=6
strategy(title="Relative Strength Index with MA Strategy", shorttitle="RSI-MA Strategy", overlay=true, default_qty_type=strategy.percent_of_equity, default_qty_value=200)

// RSI Inputs- 1