
Gambaran keseluruhan
Ini adalah strategi pengesanan trend berdasarkan pelbagai petunjuk teknikal dan pengurusan risiko. Strategi ini menggunakan pelbagai petunjuk teknikal seperti purata bergerak, indikator kuat relatif (RSI), indikator pergerakan (DMI) untuk mengenal pasti trend pasaran, dan melindungi keselamatan dana melalui kaedah kawalan risiko seperti stop loss dinamik, pengurusan kedudukan dan had pengeluaran maksimum bulanan.
Prinsip Strategi
Strategi ini menggunakan mekanisme pengesahan trend bertingkat:
- Arah trend berdasarkan purata bergerak (EMA) dengan indeks kitaran 8/21/50
- Menggunakan garis tengah saluran harga sebagai penapis trend
- Gabungan RSI rata-rata ((5 kitaran) pergerakan dalam julat 35-65 untuk menyaring pecah palsu
- Kekuatan trend disahkan melalui penunjuk DMI ((14 kitaran)
- Menggunakan penunjuk momentum ((8 kitaran) dan peningkatan jumlah pertukaran untuk mengesahkan kesinambungan trend
- Menggunakan Hentian Dinamis Berasaskan ATR untuk Mengendalikan Risiko
- Pengurusan kedudukan dengan model risiko tetap, dengan risiko 5% dari modal awal setiap dagangan
- Tetapkan had pengeluaran bulanan maksimum 10% untuk mengelakkan kerugian yang berlebihan
Kelebihan Strategik
- Memperiksa pelbagai petunjuk teknikal untuk meningkatkan ketepatan penilaian trend
- Mekanisme Hentikan Kerosakan Dinamik Mengendalikan Risiko Perdagangan Tunggal
- Pengurusan kedudukan dengan risiko tetap menjadikan penggunaan dana lebih munasabah
- Batasan pengeluaran maksimum bulanan menyediakan perlindungan sistematik terhadap risiko
- Menambah kebolehpercayaan pengesahan trend dengan penggabungan penunjuk kuantiti
- Rasio keuntungan dan kerugian 2:1 meningkatkan keuntungan jangka panjang
Risiko Strategik
- Penggunaan pelbagai indikator boleh menyebabkan kelewatan isyarat
- Isyarat palsu yang sering berlaku dalam pasaran yang bergolak
- Model risiko tetap mungkin tidak cukup fleksibel apabila kadar turun naik berubah secara mendadak
- Batasan pengeluaran bulanan boleh menyebabkan peluang perdagangan yang penting terlepas
- Kembali ke arah yang lebih buruk apabila trend berbalik
Arah pengoptimuman strategi
- Memperkenalkan parameter penunjuk yang disesuaikan untuk menyesuaikan diri dengan keadaan pasaran yang berbeza
- Membangunkan program pengurusan kedudukan yang lebih fleksibel untuk mengambil kira perubahan kadar turun naik pasaran
- Penilaian kuantitatif untuk meningkatkan intensiti trend, optimumkan masa kemasukan
- Mencipta mekanisme penghadaman risiko bulanan yang lebih bijak
- Menambah modul pengenalan keadaan pasaran untuk menyesuaikan parameter strategi dalam keadaan pasaran yang berbeza
ringkaskan
Strategi ini membangunkan sistem perdagangan trend-tracking yang agak lengkap melalui penggunaan komprehensif indikator teknikal berbilang dimensi. Kelebihan strategi ini adalah kerangka pengurusan risiko yang komprehensif, termasuk hentian dinamik, pengurusan kedudukan dan kawalan penarikan balik. Walaupun terdapat risiko ketinggalan tertentu, strategi ini dijangka dapat mengekalkan prestasi yang stabil dalam pelbagai keadaan pasaran melalui pengoptimuman dan penambahbaikan.
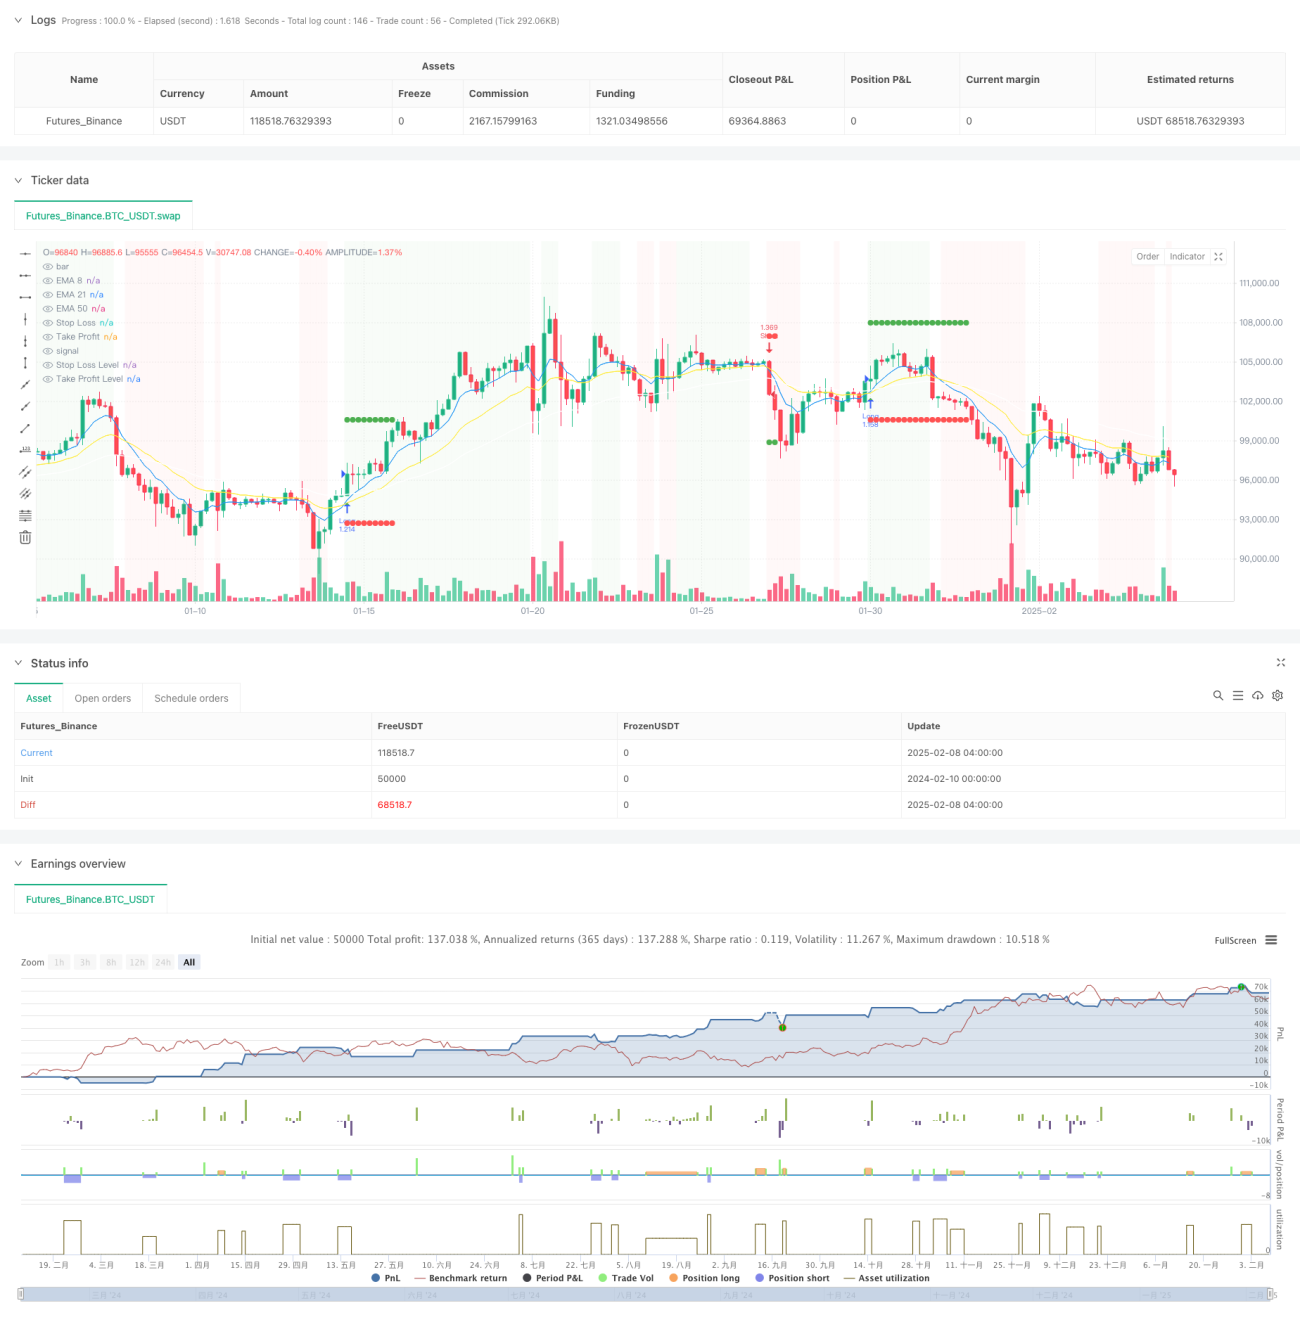
/*backtest
start: 2024-02-10 00:00:00
end: 2025-02-08 08:00:00
period: 4h
basePeriod: 4h
exchanges: [{"eid":"Futures_Binance","currency":"BTC_USDT"}]
*/

//@version=5
strategy("High Win-Rate Crypto Strategy with Drawdown Limit", overlay=true, initial_capital=10000, default_qty_type=strategy.fixed, process_orders_on_close=true)

// Moving Averages- 1