Perpindahan purata bergerak berganda dan strategi dagangan pengoptimuman julat RSI stokastik terlebih beli dan terlebih jual

1
Follow
1781
Followers
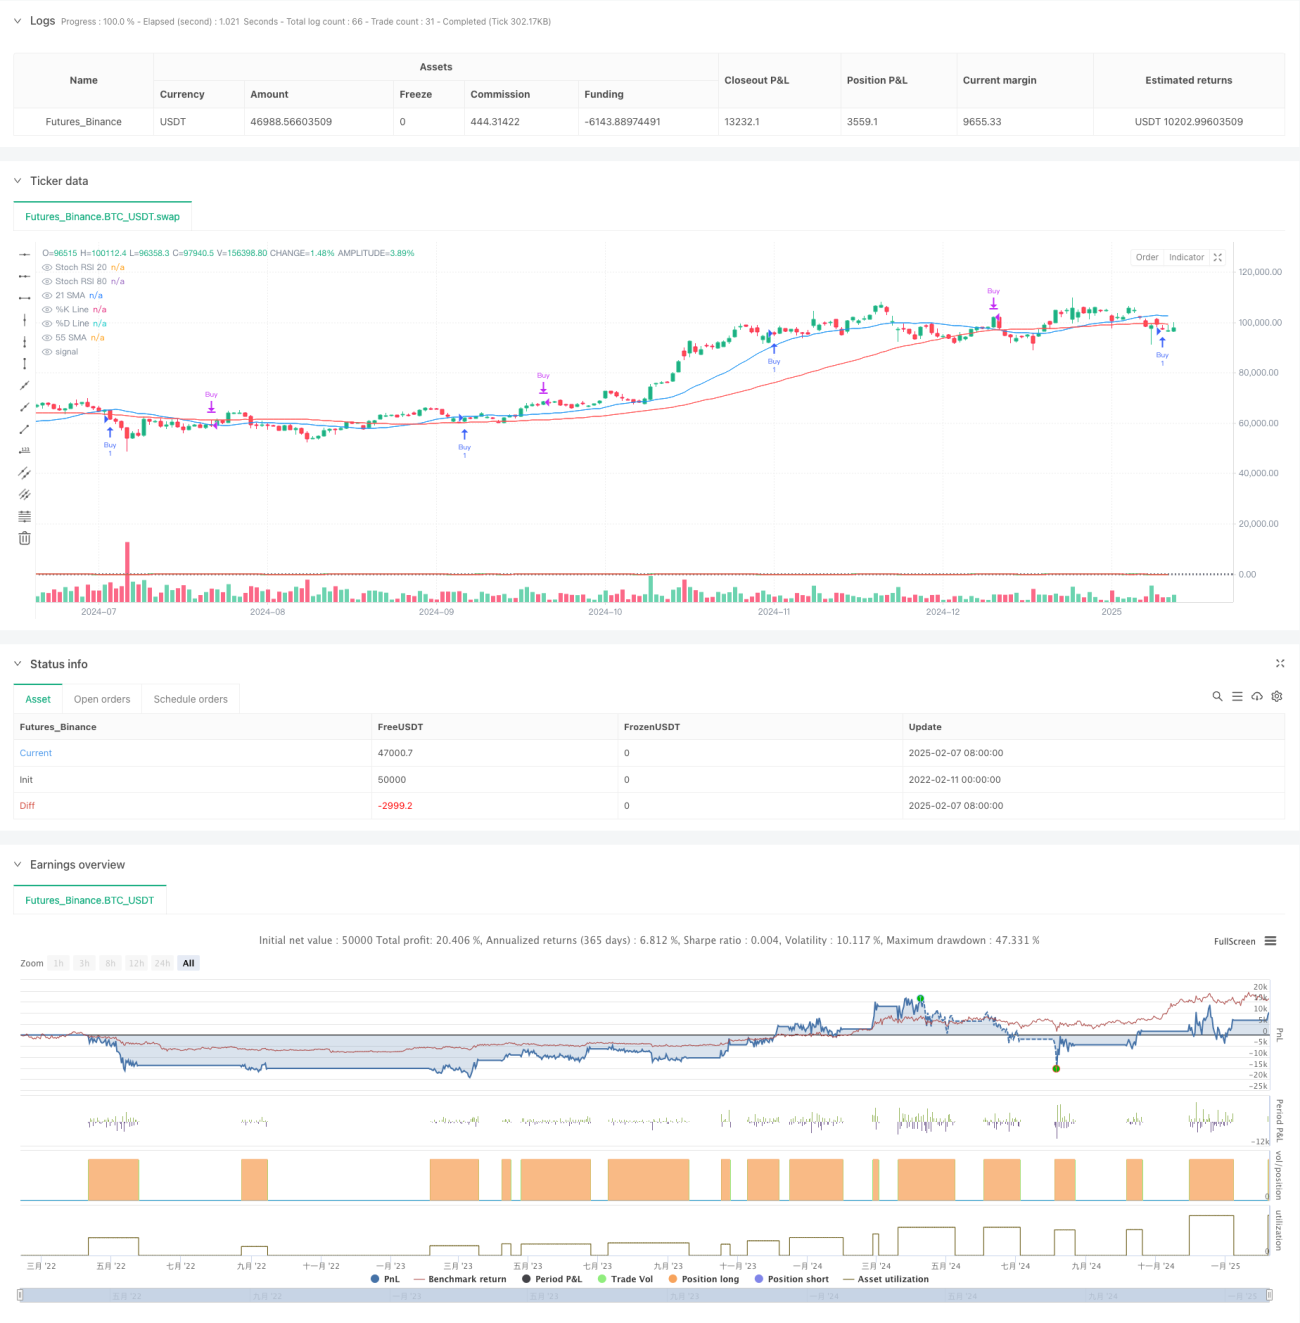
Gambaran keseluruhan
Strategi ini adalah sistem perdagangan yang mengesan trend yang menggabungkan garis rata-rata ganda dan RSI acak. Untuk menilai trend pasaran melalui purata bergerak sederhana 21 dan 55 kitaran, mencari titik masuk dan keluar yang paling baik dalam rantau overbought dan oversold RSI acak untuk mengoptimumkan perdagangan trend.
Prinsip Strategi
Strategi ini menggunakan logik teras berikut:
- Pengesahan trend: Menggunakan 21 kitaran SMA dan 55 kitaran SMA, apabila garis purata jangka pendek berada di atas garis purata jangka panjang, mengesahkan trend menaik.
- Isyarat masuk: K baris menunggu RSI rawak di bawah 20 untuk membentuk persilangan emas dengan D baris di kawasan oversold selepas trend disahkan.
- Isyarat Keluar: Apabila K-garis RSI secara rawak membentuk persimpangan mati dengan D-garis di kawasan overbought di atas 80.
- Penapisan isyarat: Mengurangkan isyarat palsu secara berkesan dengan menggabungkan trend dan indikator momentum.
Kelebihan Strategik
- Mekanisme pengesahan berganda: meningkatkan kebolehpercayaan transaksi melalui pengesahan berganda trend dan momentum.
- Pengendalian risiko yang dioptimumkan: Mengambil kesempatan daripada selang yang lebih baik untuk memilih titik masuk yang lebih baik dalam arah trend.
- Adaptif: parameter strategi boleh disesuaikan dengan ciri-ciri pasaran yang berbeza.
- Isyarat jelas: syarat kemasukan dan keluar jelas dan mudah dilaksanakan.
- Tahap sistematisasi yang tinggi: logik strategi sepenuhnya sistematis, mengurangkan penilaian subjektif.
Risiko Strategik
- Risiko pasaran yang bergolak: Perdagangan yang kerap mungkin berlaku di pasaran yang bergolak.
- Risiko keterbelakangan: Rata-rata bergerak mempunyai keterbelakangan dan mungkin terlepas peluang masuk terbaik.
- Risiko False Breakthrough: RSI rawak mungkin memberi isyarat palsu dalam pasaran yang bergolak.
- Kepekaan parameter: Kombinasi parameter yang berbeza boleh membawa kepada perbezaan besar dalam prestasi strategi.
Arah pengoptimuman strategi
- Menambah penapis turun naik: memperkenalkan penunjuk ATR untuk mengurangkan kekerapan dagangan semasa turun naik rendah.
- Optimumkan mekanisme penarikan diri: Pertimbangkan untuk memasukkan sasaran stop loss atau keuntungan bergerak.
- Klasifikasi persekitaran pasaran: Parameter penyesuaian mengikut dinamik persekitaran pasaran yang berbeza.
- Tambah pengesahan jumlah transaksi: Tambahkan penunjuk jumlah transaksi untuk mengesahkan kesahihan isyarat.
- Pengenalan penunjuk kekuatan trend: seperti ADX, untuk penapisan persekitaran trend lemah.
ringkaskan
Strategi ini membina sistem perdagangan trend yang lengkap dengan menggabungkan petunjuk teknikal klasik. Strategi ini meningkatkan kebolehpercayaan dengan pengesahan pelbagai isyarat, sementara tetap sederhana dan intuitif. Dengan pengoptimuman parameter yang munasabah dan pengurusan risiko, strategi ini mempunyai nilai praktikal yang baik.
Source
Pine
Strategy parameters
Related strategies
Comment
All comments (0)
No data
- 1