
Gambaran keseluruhan
Strategi ini adalah sistem perdagangan pengesanan trend yang inovatif yang menggunakan teknologi penyelarasan indeks dua lapisan untuk mengenal pasti trend pasaran. Sistem ini menghasilkan dua garis trend untuk menangkap pergerakan jangka pendek dan jangka panjang pasaran dengan pemprosesan penyelarasan indeks khusus terhadap data harga. Sistem ini menggabungkan modul pengurusan risiko lengkap, termasuk tetapan stop loss, dan fungsi pengurusan kedudukan yang fleksibel.
Prinsip Strategi
Strategi ini mempunyai algoritma penyelarasan indeks dua peringkat yang unik. Pertama, sistem ini memberi berat kepada harga penutupan dengan cara ((harga tertinggi + harga terendah + 2*Harga penutupan) / 4, yang dapat mengurangkan kesan bunyi pasaran. Kemudian, dengan fungsi kelancaran indeks yang disesuaikan, kurva kelancaran 9 dan 30 kitaran dikira. Apabila kurva jangka pendek melintasi kurva jangka panjang, sistem akan menghasilkan isyarat perdagangan.
Kelebihan Strategik
- Mekanisme penjanaan isyarat jelas, menggunakan konsep trend-following klasik, mudah difahami dan dilaksanakan.
- Teknologi penyelarasan indeks dua lapisan dapat menapis bunyi pasaran dengan berkesan dan meningkatkan kualiti isyarat.
- Sistem pengurusan risiko bersepadu lengkap, termasuk penghadaman dan pengurusan kedudukan.
- Sistem ini dapat menyesuaikan diri dengan pelbagai keadaan pasaran dan digunakan untuk pelbagai jenis perdagangan.
- Ia menyediakan penunjuk visual yang jelas untuk memudahkan peniaga menentukan arah pasaran dengan cepat.
Risiko Strategik
- Dalam pasaran yang bergolak, isyarat palsu yang kerap berlaku boleh menyebabkan kerugian berterusan.
- Secara lalai, 100% dana digunakan untuk berdagang, dan lebihan leverage boleh membawa risiko yang lebih besar.
- Tetapan Stop Loss dengan nilai tetap mungkin tidak sesuai untuk semua keadaan pasaran.
- Sistem ini mungkin akan tergelincir dalam pasaran yang bergelincir dan menjejaskan pelaksanaan.
- Hasil ujian sejarah tidak menjamin prestasi masa depan.
Arah pengoptimuman strategi
- Pengenalan penunjuk kadar turun naik (seperti ATR) untuk menyesuaikan titik hentian hentian secara dinamik.
- Menambah penapis kekuatan trend untuk mengurangkan kekerapan perdagangan dalam keadaan trend lemah.
- Modul pengenalan keadaan pasaran untuk menyesuaikan parameter strategi secara automatik dalam pasaran yang bergolak.
- Membangunkan sistem pengurusan kedudukan dinamik yang secara automatik menyesuaikan saiz urus niaga mengikut keadaan pasaran.
- Mengintegrasikan modul analisis asas untuk meningkatkan ketepatan keputusan perdagangan.
ringkaskan
Ini adalah sistem pengesanan trend yang direka dengan logik dan logik yang jelas. Dengan teknik penyelarasan indeks berlapis dua dan sistem pengurusan risiko yang lengkap, strategi ini dapat melakukan persembahan yang baik di pasaran yang sedang tren. Walau bagaimanapun, pengguna perlu menyesuaikan saiz kedudukan mengikut kebolehan risiko mereka sendiri, dan disarankan untuk melakukan pengesahan ulang yang mencukupi sebelum perdagangan langsung.
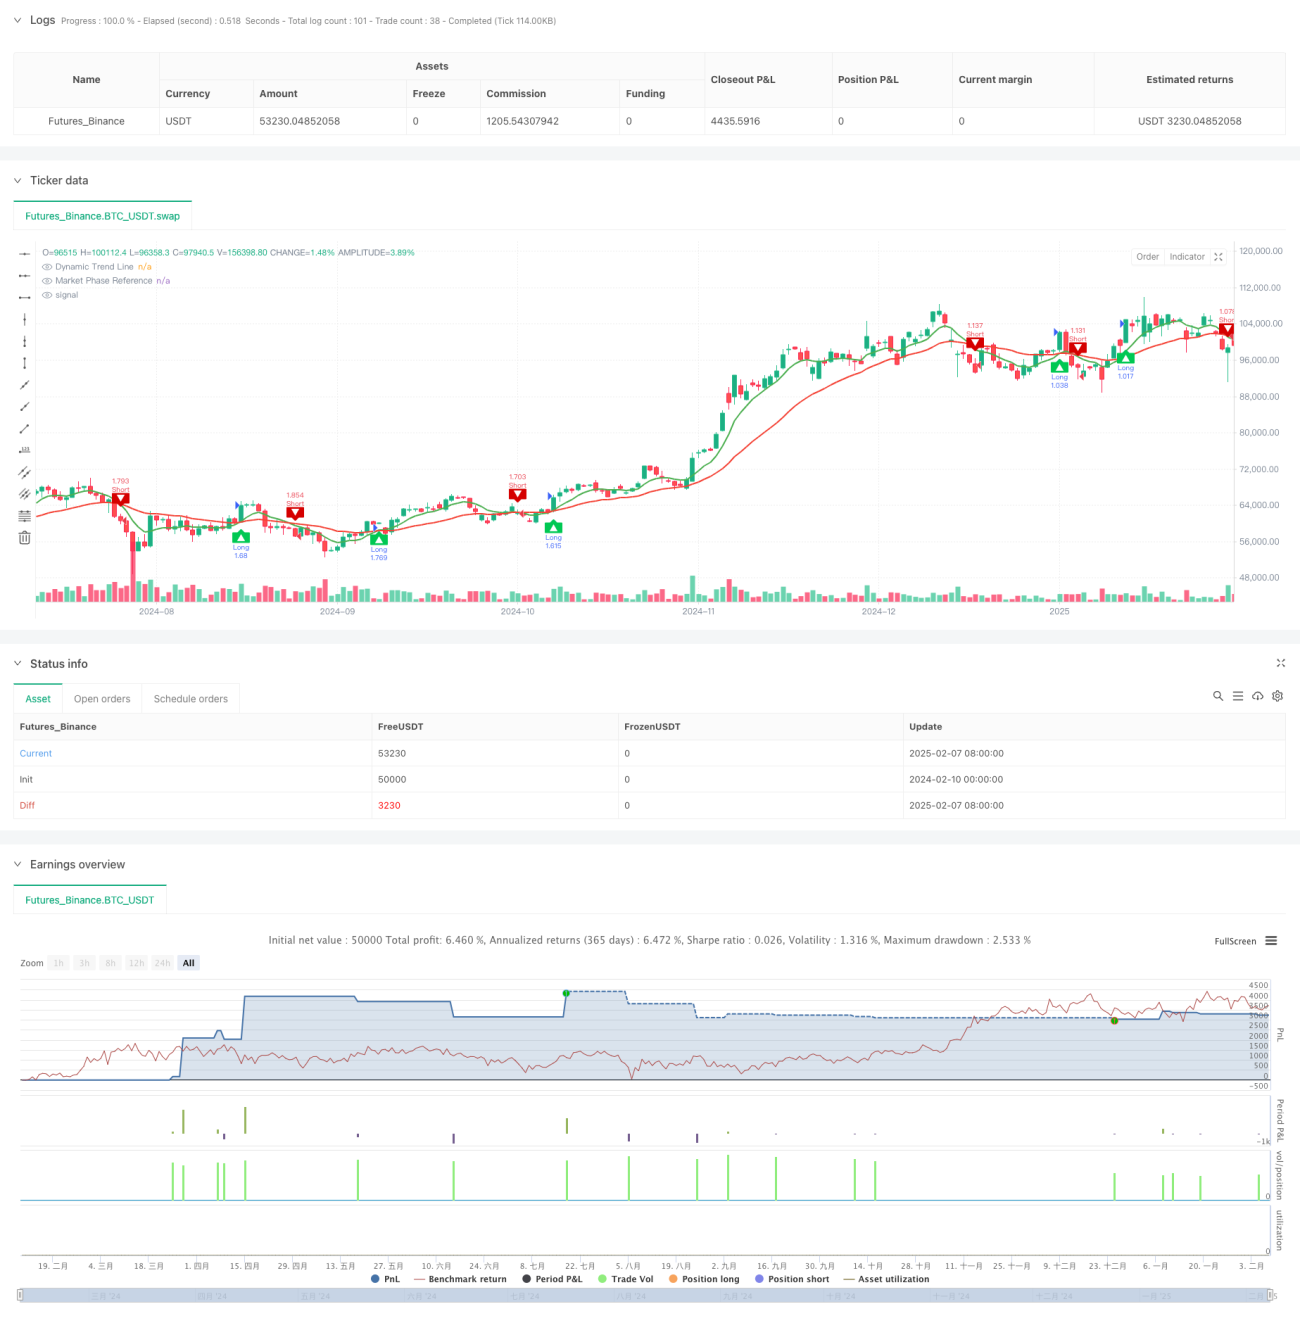
/*backtest
start: 2024-02-10 00:00:00
end: 2025-02-08 08:00:00
period: 1d
basePeriod: 1d
exchanges: [{"eid":"Futures_Binance","currency":"BTC_USDT"}]
*/

//@version=5
strategy("Dynamic Trend Navigator AI [CodingView]", overlay=true, initial_capital=100000, default_qty_type=strategy.percent_of_equity , default_qty_value=200 )
- 1