Strategi Momentum Trend - Sistem Pemasa Jalur Dinamik Zigzag Pelbagai Tempoh

Gambaran keseluruhan
Strategi ini adalah sistem perdagangan multidimensi yang menggabungkan indikator ZigZag dan William (%R). Dengan indikator ZigZag, anda dapat mengenal pasti ketinggian dan ketinggian gelombang penting, dan menggunakan William untuk mengesahkan titik masuk apabila pasaran mencapai keadaan overbought atau oversold. Kombinasi ini bukan sahaja dapat menangkap titik perubahan trend utama di pasaran, tetapi juga dapat meningkatkan ketepatan perdagangan dengan pengesahan momentum.
Prinsip Strategi
Logik utama strategi ini adalah berdasarkan dua komponen utama:
- Penunjuk kata-kata mengenal pasti ketinggian dan ketinggian gelombang yang ketara melalui kedalaman dan parameter penyimpangan yang ditetapkan, menyaring kebisingan pasaran, menentukan arah trend. Apabila titik rendah gelombang baru terbentuk, ia menandakan permulaan trend naik, dan titik tinggi gelombang baru menandakan permulaan trend menurun.
- Indeks William mengira keadaan dinamik pasaran dengan membandingkan harga semasa dengan harga tertinggi dalam tempoh tertentu. Apabila nilai indikator menembusi -80 menandakan oversold ((peluang membeli berpotensi), menembusi -20 menandakan oversold ((peluang menjual berpotensi).
Peraturan perdagangan untuk strategi ini adalah seperti berikut:
- Buat banyak syarat: Indeks bentuk kata mengenal pasti tahap rendah baru dan Indeks William melangkau ke atas dari kawasan oversold
- Keadaan kosong: Indeks bentuk kata mengenal pasti tahap tinggi baru dan Indeks William melangkau ke bawah dari kawasan overbought
- Stop loss set kepada 1% dan stop loss set kepada 2%
Kelebihan Strategik
- Pengesahan pelbagai dimensi: meningkatkan kebolehpercayaan isyarat perdagangan melalui pengesahan dua hala dan dinamik
- Adaptif: parameter defleksinya boleh disesuaikan dengan kadar turun naik pasaran yang dinamik
- Pengendalian risiko yang sempurna: menggunakan strategi stop loss dengan peratusan tetap untuk mengawal risiko setiap perdagangan
- Kesan visual yang baik: menunjukkan isyarat dagangan dengan jelas melalui label dan grafik untuk memudahkan analisis dan pengoptimuman
Risiko Strategik
- Risiko pasaran goyah: Isyarat pecah palsu yang kerap berlaku di pasaran setapak
- Risiko tergelincir: kemungkinan tergelincir yang lebih besar dalam keadaan pantas
- Sensitiviti parameter: Pilihan parameter penunjuk mempunyai kesan yang lebih besar terhadap prestasi strategi
- Laggasi isyarat: mungkin terlepas beberapa pergerakan pantas kerana perlu mengesahkan pembentukan titik gelombang baru
Arah pengoptimuman strategi
- Menambah penapis keadaan pasaran: Indikator kadar turun naik boleh ditambah untuk mengenal pasti keadaan pasaran, menggunakan tetapan parameter yang berbeza dalam keadaan yang berbeza
- Pengoptimuman hentian dinamik: kedudukan hentian boleh disesuaikan secara dinamik berdasarkan ATR atau kadar turun naik
- Memperkenalkan pengesahan jumlah transaksi: menambah pengesahan jumlah transaksi semasa isyarat dihasilkan
- Penapisan masa: penapisan masa boleh ditambah untuk mengelakkan dagangan pada masa turun naik
ringkaskan
Ini adalah sistem perdagangan yang lengkap yang menggabungkan trend tracking dan perdagangan dinamik. Dengan kerja sama serentak pelbagai petunjuk teknikal, risiko dapat dikendalikan dengan berkesan sambil mengekalkan kadar kemenangan yang tinggi. Walaupun terdapat beberapa ketinggalan, tetapi dengan pengoptimuman parameter dan pengurusan risiko yang munasabah, kesan perdagangan yang stabil dapat dicapai.
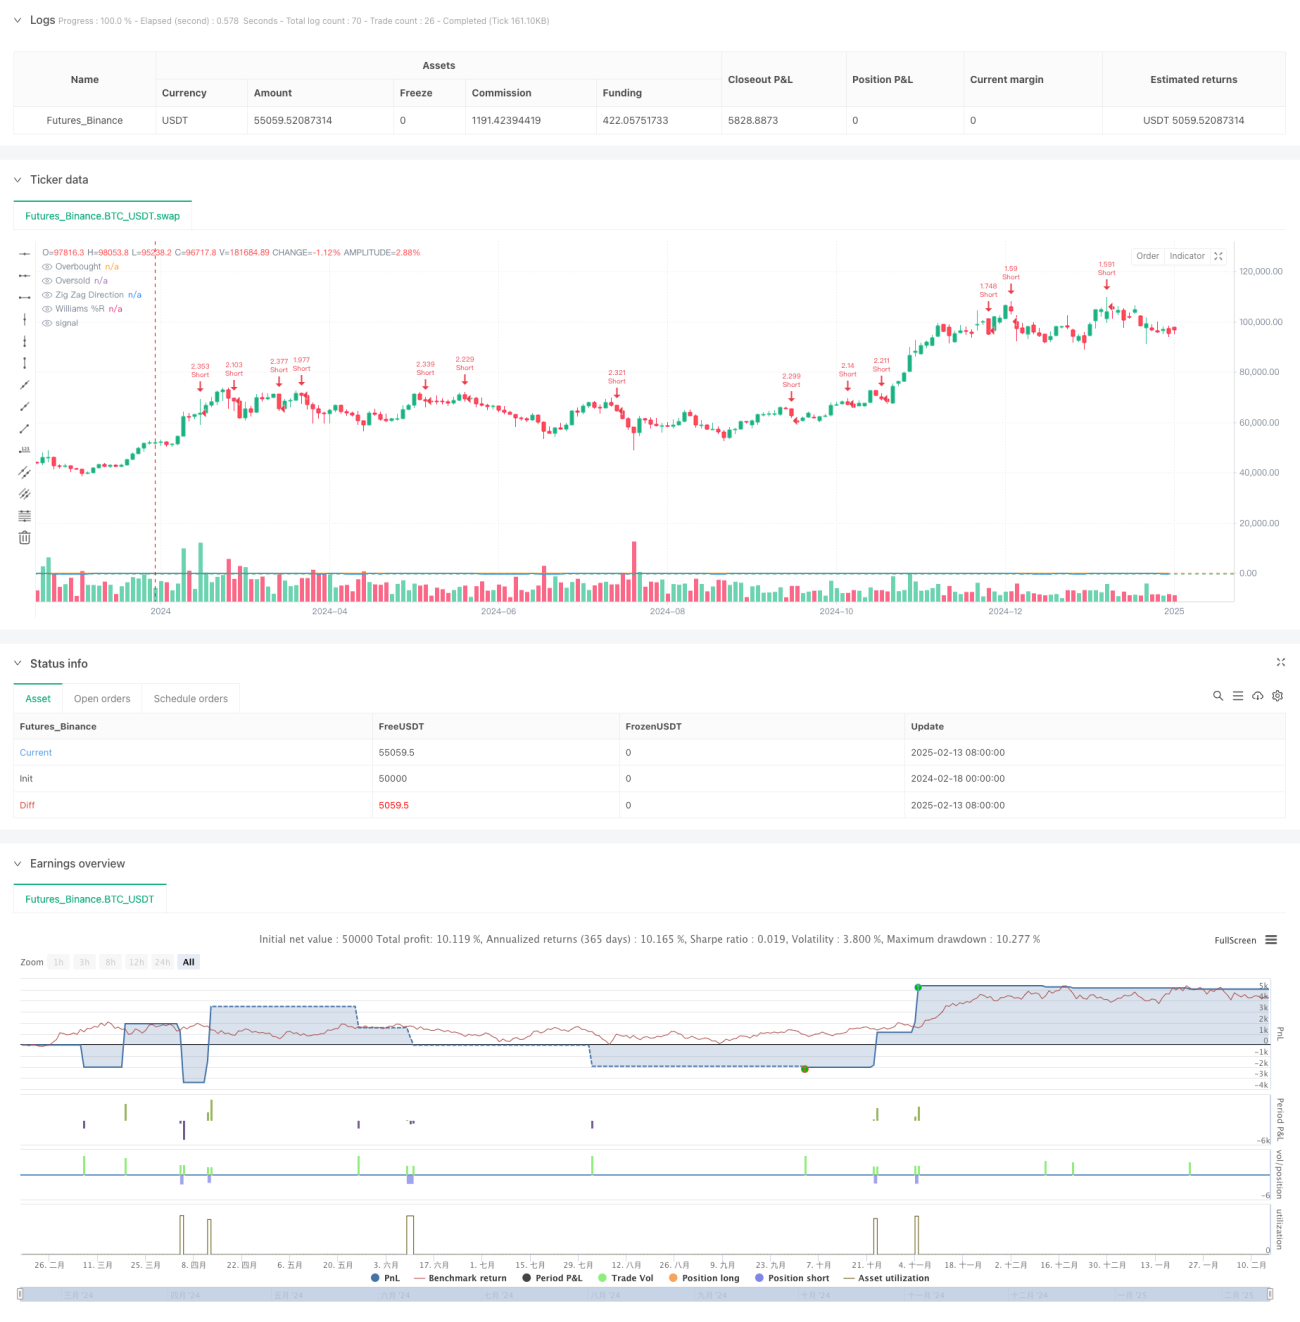
/*backtest
start: 2024-02-18 00:00:00
end: 2025-02-15 08:00:00
period: 2d
basePeriod: 2d
exchanges: [{"eid":"Futures_Binance","currency":"BTC_USDT"}]
*/

//@version=6
strategy("Zig Zag + Williams %R Strategy", overlay=true, default_qty_type=strategy.percent_of_equity, default_qty_value=300)

// ====================- 1