
Gambaran keseluruhan
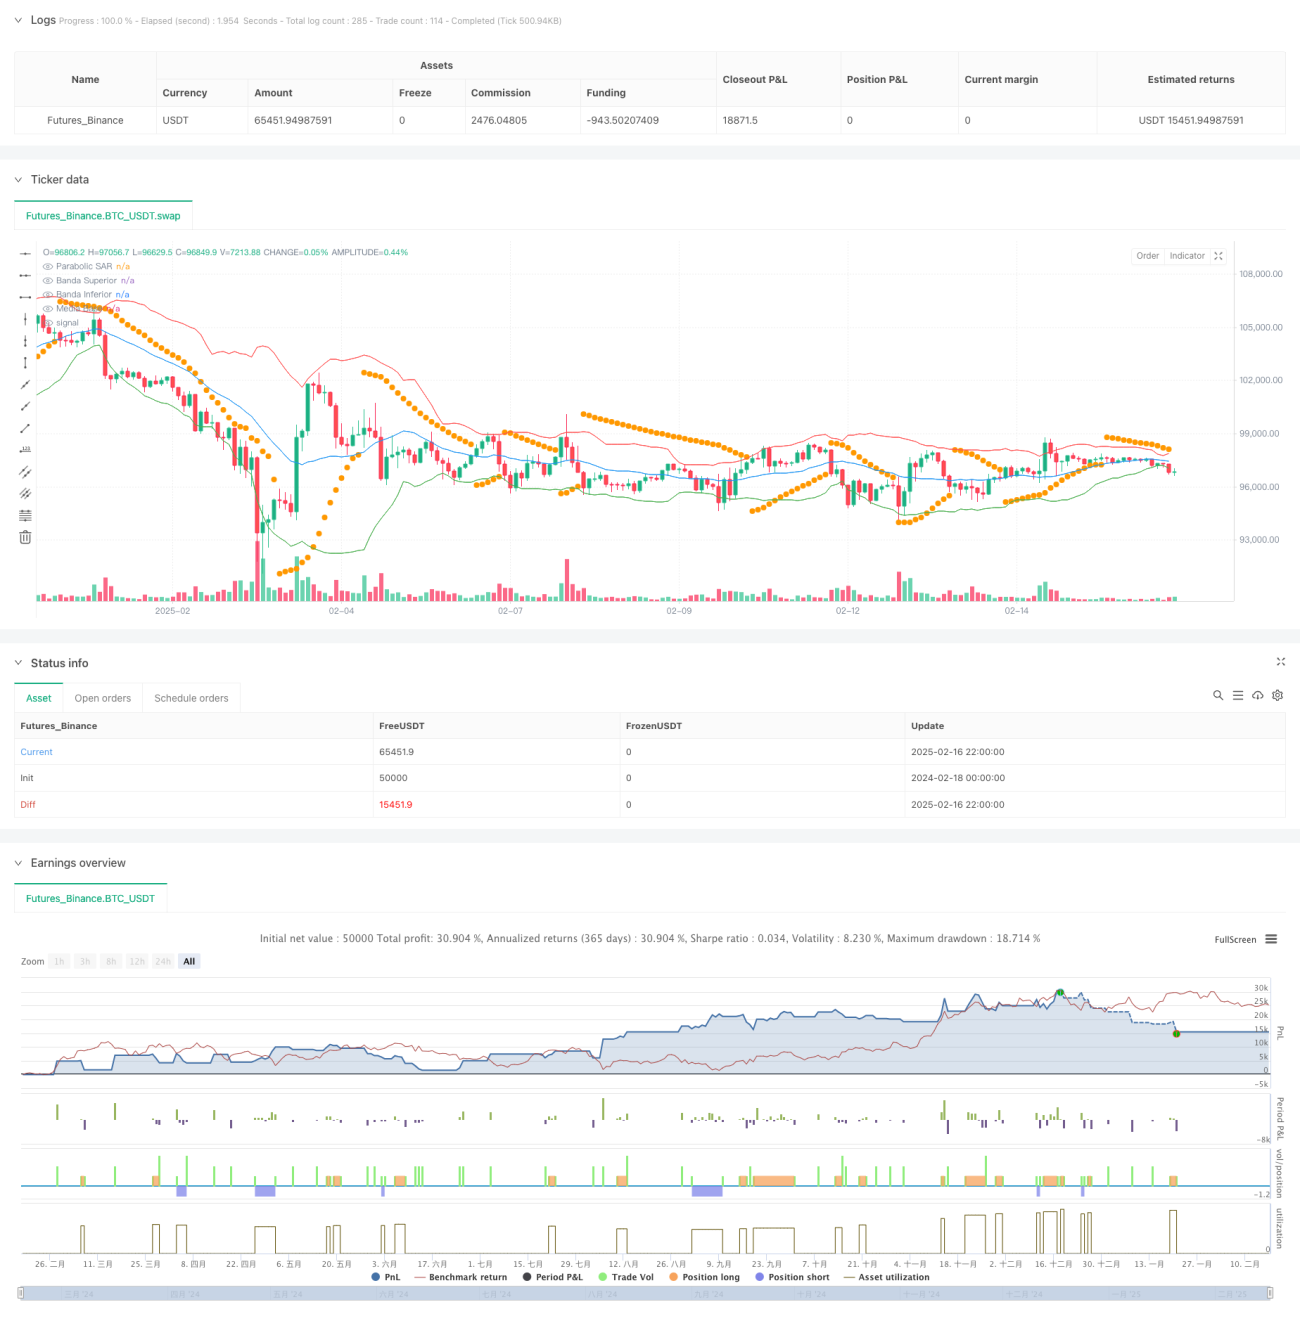
Ini adalah strategi perdagangan komprehensif yang menggabungkan Brin Belt dan Parallax Line Shift Indicator (PSAR) untuk menguruskan perdagangan menggunakan nisbah risiko / keuntungan yang tetap. Strategi ini beroperasi terutamanya pada masa perdagangan dalam hari, untuk mengenal pasti peluang perdagangan melalui harga yang menembusi Brin Belt dan corak grafik, sambil menggunakan indikator PSAR untuk mengesahkan trend.
Prinsip Strategi
Strategi menggunakan pelbagai petunjuk teknikal untuk mengesahkan isyarat perdagangan:
- Menggunakan 20 kitaran pita Brin sebagai penunjuk utama untuk pergerakan harga
- Menggunakan indikator PSAR ((bermula 0.02, maksimum 0.2) sebagai alat pengesahan trend
- Hitung nisbah entiti kabel ((panjang entiti / panjang keseluruhan ≥ 0.33) untuk memastikan kebolehpercayaan isyarat
- Melakukan transaksi dalam tetingkap masa dagangan yang ditetapkan (GMT-5 7:30-16:00)
- Syarat kemasukan berbilang: harga penutupan menembusi trek dan nisbah entiti penyu memenuhi keperluan
- Syarat kemasukan kosong: harga penutupan menembusi ke bawah dan nisbah entiti penyu memenuhi keperluan
Kelebihan Strategik
- Menggabungkan pelbagai petunjuk teknikal untuk meningkatkan kebolehpercayaan isyarat
- Menggunakan nisbah ganjaran risiko tetap ((1:3), yang membantu untuk keuntungan yang stabil dalam jangka panjang
- Penapisan masa untuk mengelakkan gangguan semasa kelembapan rendah
- Penapisan nisbah entiti menggunakan titanium, mengurangkan penembusan palsu
- Tetapkan sasaran berhenti rugi dan keuntungan yang dinamik untuk menyesuaikan diri dengan turun naik pasaran
- Logik strategi jelas, mudah difahami dan dioptimumkan
Risiko Strategik
- Kemungkinan tergelincir dalam pasaran yang bergolak
- Risiko tetap berbanding keuntungan yang mungkin terlepas sebahagian daripada peluang keuntungan
- Penapisan masa mungkin terlepas peluang pasaran yang penting
- Penunjuk berbilang boleh menyebabkan ketinggalan isyarat
- Kemungkinan kerugian berterusan dalam pasaran yang bergolak
Arah pengoptimuman strategi
- Memperkenalkan kitaran Burin yang beradaptasi untuk menyesuaikan diri dengan keadaan pasaran yang berbeza
- Risiko dan ganjaran dalam membangunkan mekanisme yang dinamik
- Tambah penunjuk volum sebagai pengesahan tambahan
- Mengoptimumkan parameter PSAR untuk meningkatkan kesan trend
- Bergabung dengan penapis kadar turun naik pasaran
- Membangunkan mekanisme penapisan masa yang lebih pintar
ringkaskan
Strategi ini membina satu sistem perdagangan yang lengkap dengan menggunakan integrasi Brinband, indikator PSAR dan analisis grafik. Kelebihan utama strategi ini adalah sinergi pelbagai indikator teknikal dan pengurusan risiko yang ketat. Walaupun terdapat beberapa risiko yang wujud, strategi ini dapat meningkatkan kestabilan dan keuntungan dengan arah pengoptimuman yang disyorkan.
- 1