
Gambaran Keseluruhan
Strategi ini adalah sistem perdagangan pengesanan arah aliran berdasarkan Indeks Kekuatan Relatif (RSI) yang dipertingkatkan. Ia mengira versi RSI yang diubah suai dan menggabungkan isyarat garisnya untuk menangkap peluang pembalikan arah aliran dalam kitaran pasaran yang berbeza. Strategi ini bukan sahaja mengira nilai penunjuk, tetapi juga memaparkan kawasan terlebih beli dan terlebih jual secara visual, membantu pedagang menilai keadaan pasaran dengan lebih intuitif.
Prinsip Strategi
Prinsip teras strategi adalah untuk mengenal pasti arah aliran pasaran melalui pengiraan RSI yang dipertingkatkan (ARSI). Secara khususnya termasuk:
- Mengira harga tertinggi dan terendah dalam tempoh yang ditetapkan untuk mendapatkan julat harga
- Mengira perbezaan berdasarkan perubahan harga
- Menggunakan kaedah purata bergerak pilihan (EMA, SMA, RMA, TMA) untuk melicinkan perbezaan
- Menormalkan hasil ke dalam julat 0-100
- Menghasilkan isyarat beli apabila ARSI melintasi garis isyarat di bawah 50
- Menghasilkan isyarat jual apabila ARSI jatuh di bawah garis isyarat di atas 50
Kelebihan Strategi
- Mekanisme pengesahan isyarat yang lengkap – melalui persilangan ARSI dengan garis isyarat dan penapisan paksi tengah, memastikan kebolehpercayaan isyarat
- Kebolehsuaian tinggi – menyokong pelbagai kaedah purata bergerak, boleh dilaraskan mengikut ciri pasaran yang berbeza
- Pengurusan risiko yang munasabah – menggunakan kaedah pengurusan peratusan kedudukan, mengawal risiko setiap dagangan dengan berkesan
- Kesan visual yang jelas – menonjolkan kawasan terlebih beli dan terlebih jual dengan isian warna, memudahkan penilaian pantas
- Pengurusan kedudukan terbalik – menutup kedudukan sedia ada secara automatik apabila isyarat bertentangan muncul, mengelakkan risiko kedudukan dua hala
Risiko Strategi
- Risiko pasaran berayun – mungkin menghasilkan isyarat palsu yang kerap dalam pasaran sisi
- Risiko ketinggalan – disebabkan penggunaan purata bergerak dalam pengiraan, isyarat akan mempunyai sedikit ketinggalan
- Kepekaan parameter – tetapan parameter yang berbeza boleh menyebabkan prestasi strategi yang berbeza secara ketara
- Risiko kebolehsuaian pasaran – prestasi strategi mungkin berbeza dengan ketara dalam persekitaran pasaran yang berbeza
- Risiko pengurusan modal – pengurusan kedudukan peratusan tetap boleh membawa risiko yang lebih besar semasa turun naik yang melampau
Arah Pengoptimuman Strategi
- Memperkenalkan penapisan turun naik – boleh menambah penunjuk ATR untuk menapis isyarat dagangan dalam persekitaran turun naik yang rendah
- Menambah penunjuk pengesahan arah aliran – menggabungkan penunjuk arah aliran jangka panjang untuk meningkatkan kebolehpercayaan isyarat
- Mengoptimumkan pengurusan kedudukan – melaraskan nisbah pegangan secara dinamik berdasarkan turun naik pasaran
- Menambah mekanisme henti rugi – menetapkan henti rugi dinamik berdasarkan ATR untuk mengawal risiko dengan lebih baik
- Membangunkan parameter penyesuaian – mengkaji kaedah pengoptimuman dinamik parameter untuk meningkatkan kebolehsuaian strategi
Kesimpulan
Ini adalah strategi pengesanan arah aliran yang lengkap dari segi struktur dan jelas dari segi logik. Melalui kaedah pengiraan RSI yang dipertingkatkan, digabungkan dengan kelebihan pelbagai penunjuk teknikal, ia membentuk sistem dagangan yang boleh dipercayai. Walaupun terdapat beberapa risiko yang wujud, melalui pengoptimuman yang munasabah dan langkah pengurusan risiko, strategi ini mempunyai prospek aplikasi praktikal yang baik. Adalah disarankan bahawa apabila pedagang menggunakannya dalam dagangan sebenar, mereka perlu menguji tetapan parameter dengan secukupnya, dan menyesuaikan konfigurasi strategi mengikut persekitaran pasaran.
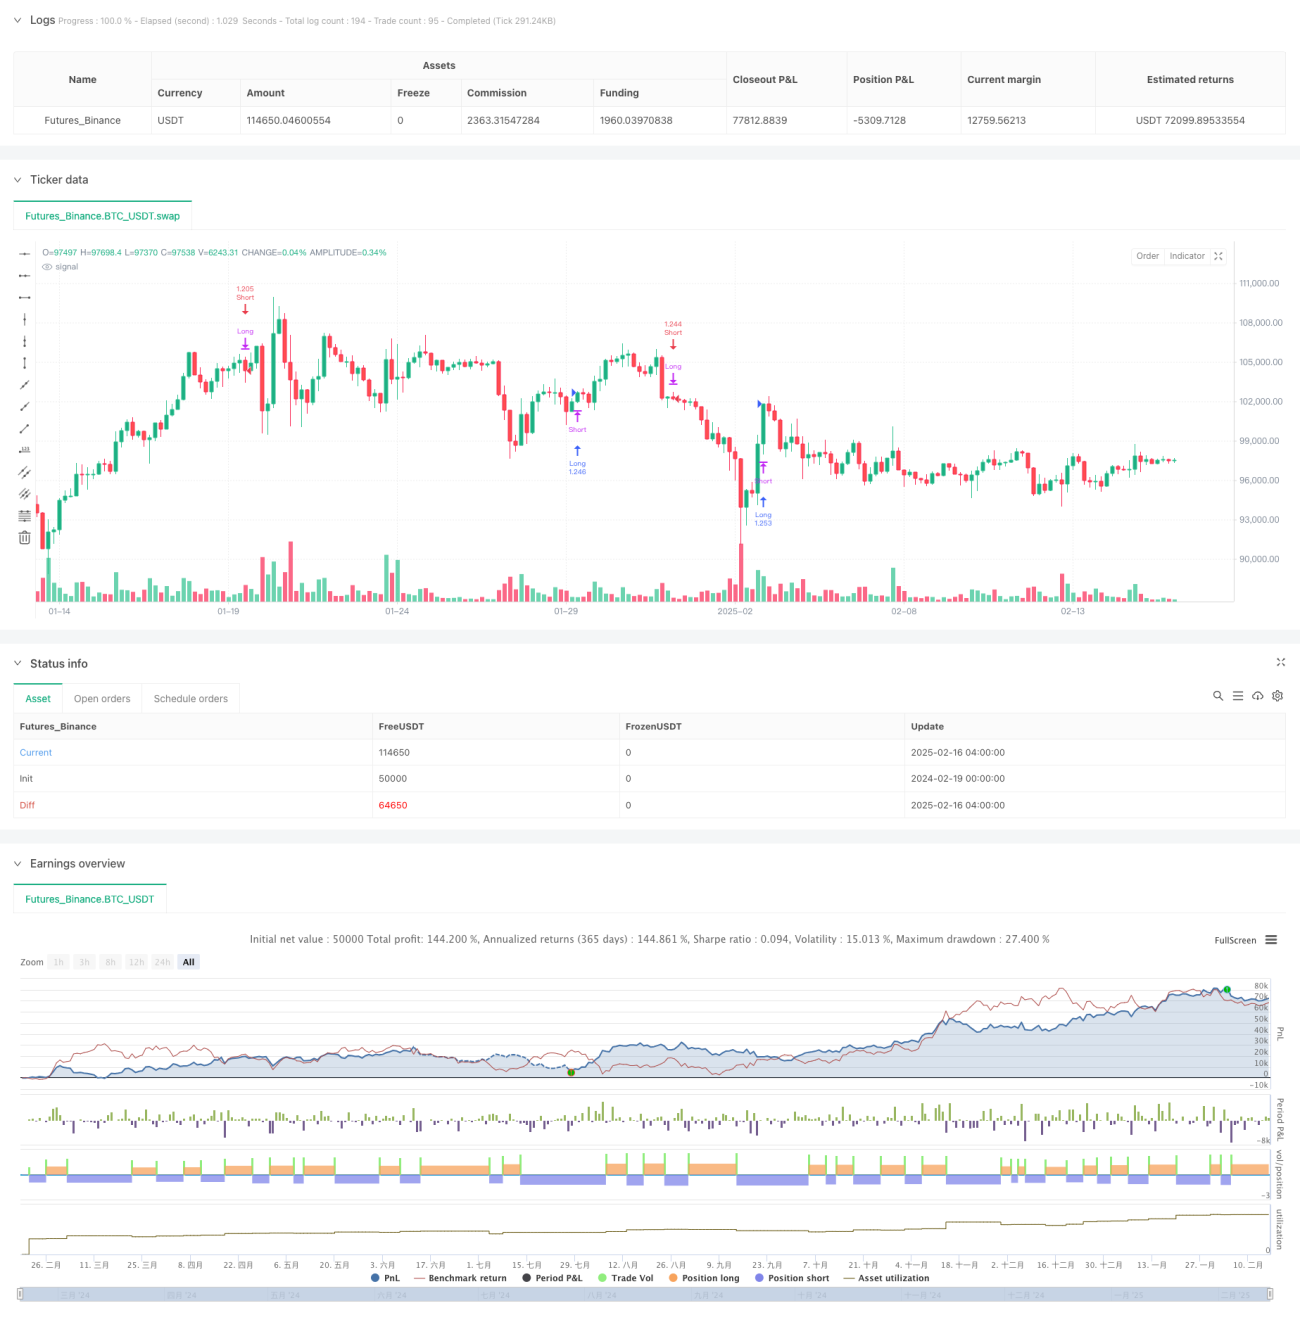
/*backtest
start: 2024-02-19 00:00:00
end: 2025-02-16 08:00:00
period: 4h
basePeriod: 4h
exchanges: [{"eid":"Futures_Binance","currency":"BTC_USDT"}]
*/

//@version=6
strategy("Ultimate RSI [LuxAlgo] Strategy", shorttitle="ULT RSI Strat", overlay=false, initial_capital=10000, currency=currency.USD, default_qty_type=strategy.percent_of_equity, default_qty_value=100)

//------------------------------------------------------------------------------- 1