
Strategi ini adalah sistem dagangan kuantitatif berdasarkan saluran regresi linear dan carta Heinrich-Ansch yang menggabungkan mekanisme hentian dan hentian dinamik yang khusus untuk menangkap peluang turun naik yang cepat di pasaran.
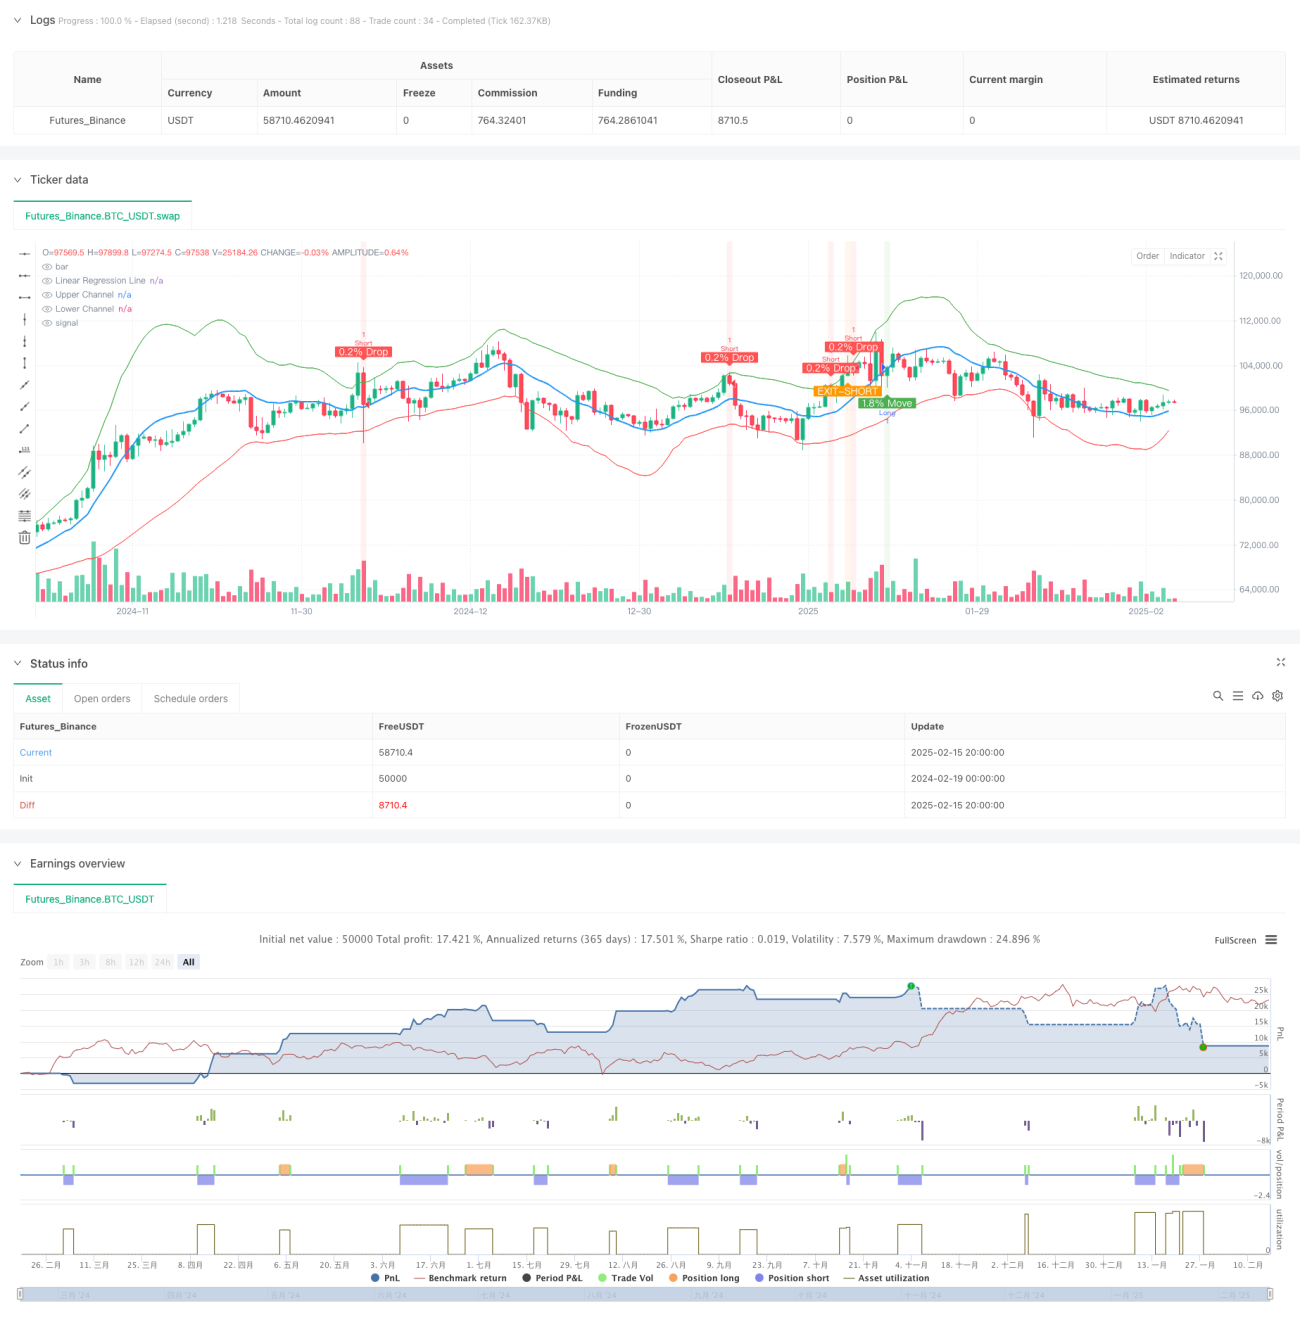
Strategi ini menggunakan saluran regresi linear sebagai kerangka perdagangan utama untuk mengenal pasti peluang perdagangan yang berpotensi dengan memantau pergerakan harga di dalam saluran. Apabila harga menembusi saluran bawah dan naik lebih dari 1.8%, sistem akan mengeluarkan banyak isyarat; apabila harga menembusi saluran atas dan turun lebih dari 0.2%, sistem akan mengeluarkan kosong.
Strategi ini adalah berdasarkan pengiraan regresi linear selama 30 kitaran, dengan lebar saluran ditetapkan sebanyak 2 kali perbezaan piawai. Isyarat masuk berdasarkan syarat berikut:
Strategi ini menyediakan pedagang dengan sistem perdagangan yang agak lengkap dengan cara menggabungkan saluran pengembalian linear dan penembusan harga. Kelebihannya adalah menggabungkan beberapa petunjuk teknikal dan langkah-langkah kawalan risiko, tetapi masih perlu dioptimumkan dan disesuaikan dengan keadaan pasaran sebenar.
/*backtest
start: 2024-02-19 00:00:00
end: 2025-02-16 08:00:00
period: 12h
basePeriod: 12h
exchanges: [{"eid":"Futures_Binance","currency":"BTC_USDT"}]
*/
//@version=6
strategy('STRATEGY WITH SL', overlay=true)
// Parameters for Linear Regression
length = input.int(30, title='Linear Regression Length')
mult = input.float(2.0, title='Channel Multiplier', step=0.1)
// Calculate Linear Regression
regression_line = ta.linreg(close, length, 0)
// Calculate Standard Deviation
stddev = ta.stdev(close, length)
// Upper and Lower Channel Boundaries
upper_channel = regression_line + mult * stddev
lower_channel = regression_line - mult * stddev
// Plot the Linear Regression and Channel
plot(regression_line, color=color.blue, linewidth=2, title='Linear Regression Line')
plot(upper_channel, color=color.green, linewidth=1, title='Upper Channel')
plot(lower_channel, color=color.red, linewidth=1, title='Lower Channel')
// Parameters for Price Move Check (Indicator 1: 1.8% Move)
threshold_move = 1.8
large_threshold_move = 5.0
timeframe_for_large_move = 120
// Calculate the percentage change over the last 3 minutes
priceChange = (close - close[3]) / close[3] * 100
// Calculate the percentage change over the last 2 hours (120 minutes)
priceChange2Hour = (close - close[120]) / close[120] * 100
// Condition for a price move greater than 1.8%
isPriceUp = priceChange > threshold_move
// Condition for price move greater than 5% in 2 hours (no alert if true)
isLargePriceMove = priceChange2Hour > large_threshold_move
// Parameters for Price Drop Check (Indicator 2: 0.2% Drop)
threshold_drop = 0.2 / 100 // 0.2% threshold
// Get the price 3 minutes ago
price_3min_ago = request.security(syminfo.tickerid, '3', close[1])
// Calculate the percentage drop over the last 3 minutes
price_drop = (close - price_3min_ago) / price_3min_ago
// Condition for a 0.2% drop
drop_condition = price_drop <= -threshold_drop
// Track whether the price has crossed the upper or lower Linear Regression channel
var bool lower_crossed = false
var bool upper_crossed = false
var bool move_after_cross = false
var bool alert_sent = false
// Reset flags when price crosses channels
if (close < lower_channel)
lower_crossed := true
move_after_cross := false
if (close > upper_channel)
upper_crossed := true
alert_sent := false
// Combine both conditions for price crossing lower and upper channels and move/drop conditions
final_condition_long = lower_crossed and isPriceUp and not move_after_cross and not isLargePriceMove
final_condition_short = upper_crossed and drop_condition and not alert_sent
// Set flags when conditions are met
if (final_condition_long)
move_after_cross := true
if (final_condition_short)
alert_sent := true
// Heikin-Ashi calculation for dynamic timeframe (3-minute)
heikin_open = (open + close) / 2
heikin_close = (open + high + low + close) / 4
heikin_high = math.max(high, math.max(heikin_open, heikin_close))
heikin_low = math.min(low, math.min(heikin_open, heikin_close))
// Conditions for EXIT signals based on Heikin-Ashi candle body
exit_long_condition = (heikin_open > lower_channel and heikin_close < lower_channel) or (heikin_open < lower_channel and heikin_close > lower_channel)
exit_short_condition = heikin_open < upper_channel and heikin_close > upper_channel
// Strategy logic: Enter long or short based on the combined conditions
// Long Entry Condition
if (final_condition_long)
strategy.entry('Long', strategy.long)
// Short Entry Condition
if (final_condition_short)
strategy.entry('Short', strategy.short)
// Exit Conditions (EXIT-LONG and EXIT-SHORT)
if (exit_long_condition)
strategy.close('Long')
if (exit_short_condition)
strategy.close('Short')
// Take Profit and Stop Loss
take_profit = 10 / 100 // 10% Take Profit
stop_loss = 5 / 100 // 5% Stop Loss
// Calculate Take Profit and Stop Loss levels based on entry price
long_take_profit = strategy.position_avg_price * (1 + take_profit)
long_stop_loss = strategy.position_avg_price * (1 - stop_loss)
short_take_profit = strategy.position_avg_price * (1 - take_profit)
short_stop_loss = strategy.position_avg_price * (1 + stop_loss)
// Apply Take Profit and Stop Loss for Long and Short positions
strategy.exit('Take Profit/Stop Loss Long', from_entry='Long', limit=long_take_profit, stop=long_stop_loss)
strategy.exit('Take Profit/Stop Loss Short', from_entry='Short', limit=short_take_profit, stop=short_stop_loss)
// Plot background color when the conditions are met (for visual aid)
bgcolor(final_condition_long ? color.new(color.green, 90) : na, title='Price Move Alert After Lower Channel Crossed')
bgcolor(final_condition_short ? color.new(color.red, 90) : na, title='Price Drop Alert After Upper Channel Crossed')
bgcolor(exit_long_condition ? color.new(color.blue, 90) : na, title='EXIT-LONG Alert')
bgcolor(exit_short_condition ? color.new(color.orange, 90) : na, title='EXIT-SHORT Alert')
// Plot shapes when conditions are met
plotshape(final_condition_long, style=shape.labelup, location=location.belowbar, color=color.green, text='1.8% Move', textcolor=color.white, size=size.small)
plotshape(final_condition_short, style=shape.labeldown, location=location.abovebar, color=color.red, text='0.2% Drop', textcolor=color.white, size=size.small)
plotshape(exit_long_condition, style=shape.labeldown, location=location.abovebar, color=color.purple, text='EXIT-LONG', textcolor=color.white, size=size.small)
plotshape(exit_short_condition, style=shape.labelup, location=location.belowbar, color=color.orange, text='EXIT-SHORT', textcolor=color.white, size=size.small)
// Alert conditions for price moves and exits
alertcondition(final_condition_long, title="Price Move > 1.8% After Lower LR Channel Cross", message="Price crossed the lower Linear Regression Channel and moved more than 1.8% in the last 3 minutes!")
alertcondition(final_condition_short, title="Price Drop > 0.2% After Upper LR Channel Cross", message="Price crossed the upper Linear Regression Channel and dropped more than 0.2% in the last 3 minutes!")
alertcondition(exit_long_condition, title="EXIT-LONG: Heikin-Ashi Candle Body Crossing Lower LR Channel", message="The body of a 3-minute Heikin-Ashi candle is crossing outside the lower Linear Regression Channel.")
alertcondition(exit_short_condition, title="EXIT-SHORT: Heikin-Ashi Candle Body Crossing Upper LR Channel", message="The body of a 3-minute Heikin-Ashi candle is crossing outside the upper Linear Regression Channel.")