
Gambaran keseluruhan
Ini adalah strategi perdagangan terobosan berdasarkan tindakan harga semata-mata, yang direka dengan nisbah ganjaran risiko tinggi 1: 5. Strategi ini melakukan perdagangan dengan mengenal pasti penembusan tahap harga penting, dan menggabungkan struktur pasaran yang dinamik untuk menetapkan sasaran stop-loss dan keuntungan. Strategi ini tidak bergantung pada sebarang petunjuk teknikal, membuat keputusan perdagangan sepenuhnya berdasarkan tindakan harga masa nyata.
Prinsip Strategi
Logik teras strategi merangkumi bahagian penting berikut:
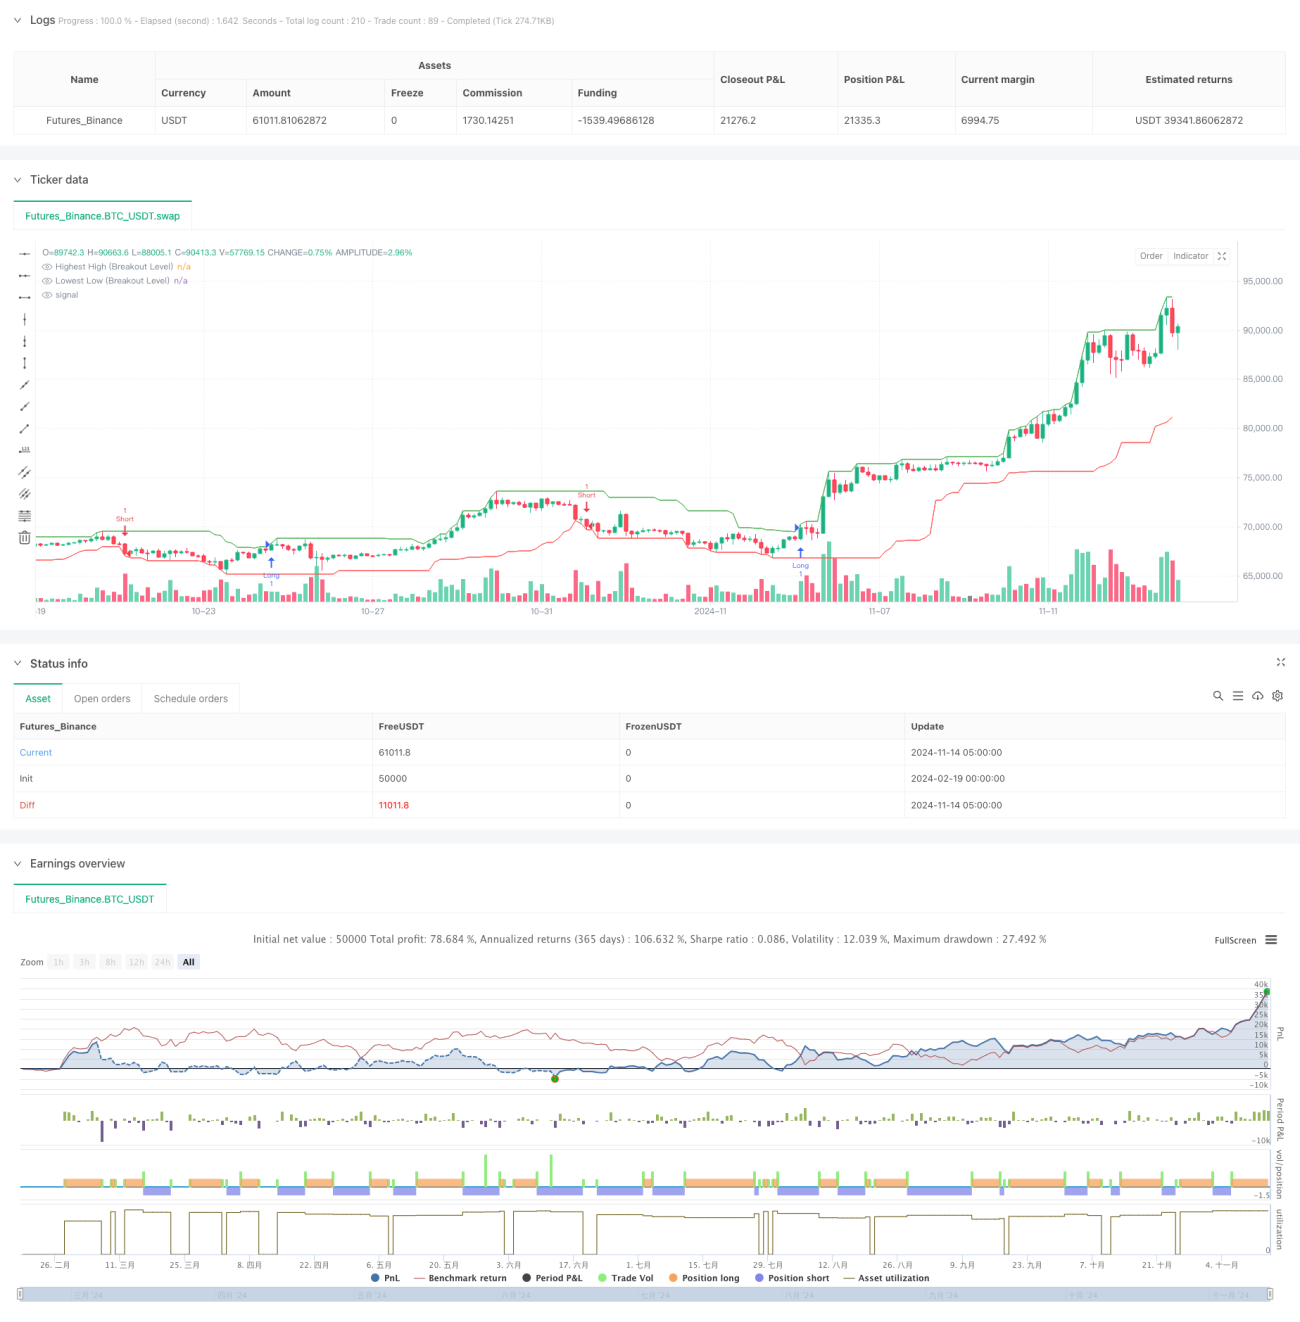
- Membentuk titik rujukan untuk penembusan dengan mengenal pasti tahap harga tertinggi dan terendah pada tempoh yang telah dipetik
- Terbuka lebih banyak kedudukan apabila harga penutupan menembusi paras tertinggi sebelum ini, terbuka kosong apabila menembusi paras rendah sebelum ini
- Berdasarkan kedudukan berhenti dinamik yang ditetapkan untuk turun naik dalam masa terdekat, banyak kedudukan yang ditetapkan untuk berhenti pada titik rendah, kedudukan kosong yang ditetapkan untuk berhenti pada titik tinggi
- Lokasi sasaran keuntungan yang dikira berdasarkan nisbah risiko / pulangan 1: 5
- Tetapkan had maksimum perdagangan harian untuk mengelakkan perdagangan berlebihan
Keseluruhan proses perdagangan adalah berdasarkan kepada pergerakan harga tanpa menggunakan sebarang petunjuk teknikal sebagai rujukan.
Kelebihan Strategik
- Berdagang dengan harga murni untuk mengelakkan gangguan yang disebabkan oleh ketinggalan indeks
- Reka bentuk dengan perbandingan ganjaran-risiko tinggi, dengan potensi keuntungan 5 kali ganda daripada risiko setiap dagangan
- Tetapan Henti Kerosakan Dinamik, menyesuaikan diri mengikut struktur pasaran
- Isyarat perdagangan yang jelas dan penanda visual untuk memudahkan pelaksanaan perdagangan
- Parameter sangat boleh dilaraskan untuk menyesuaikan diri dengan persekitaran pasaran yang berbeza
- Kawalan risiko yang ketat, termasuk had perdagangan harian
Risiko Strategik
- Tanda-tanda penembusan palsu yang kerap berlaku di pasaran yang bergolak
- Nisbah ganjaran risiko tinggi boleh menyebabkan peluang kemenangan yang agak rendah
- Penyusunan semula selepas penembusan mungkin mencetuskan kerugian
- Perubahan dalam turun naik pasaran mungkin mempengaruhi prestasi strategi
- Pergerakan harga yang lebih besar diperlukan untuk mencapai sasaran keuntungan
Langkah-langkah mitigasi:
- Menggunakan strategi ini dalam pasaran yang sedang trending
- Elakkan berdagang semasa siaran berita penting
- Skala kedudukan yang munasabah
- Semak dan optimumkan parameter secara berkala
Arah pengoptimuman strategi
- Menambah penapis trend, hanya berdagang ke arah trend utama
- Menambah mekanisme pengesahan kuantiti untuk meningkatkan kebolehpercayaan kejayaan
- Tahap risiko-reward yang disesuaikan dengan pergerakan kadar turun naik
- Memperkenalkan analisis kitaran masa berbilang untuk meningkatkan ketepatan transaksi
- Membangunkan mekanisme penangguhan yang lebih pintar, seperti menjejaki penangguhan
- Menambah keupayaan untuk mengenal pasti keadaan pasaran, menyesuaikan parameter strategi
ringkaskan
Ini adalah strategi perdagangan tingkah laku harga yang dirancang dengan ketat dan logik yang jelas. Dengan reka bentuk nisbah pulangan risiko yang tinggi, mengejar keuntungan yang ketara sambil mengawal risiko dengan berkesan. Kelebihan strategi terletak pada pemanduan harga tulen, fleksibiliti parameter, dan kawalan risiko yang sempurna. Walaupun terdapat risiko penembusan palsu, kestabilan dan kebolehpercayaan strategi dapat ditingkatkan lagi dengan arah pengoptimuman yang disyorkan.
- 1