Mengikut Arah Aliran Purata Pergerakan Volum Dinamik dan Strategi Dagangan Pecahan HLCC4

Gambaran keseluruhan
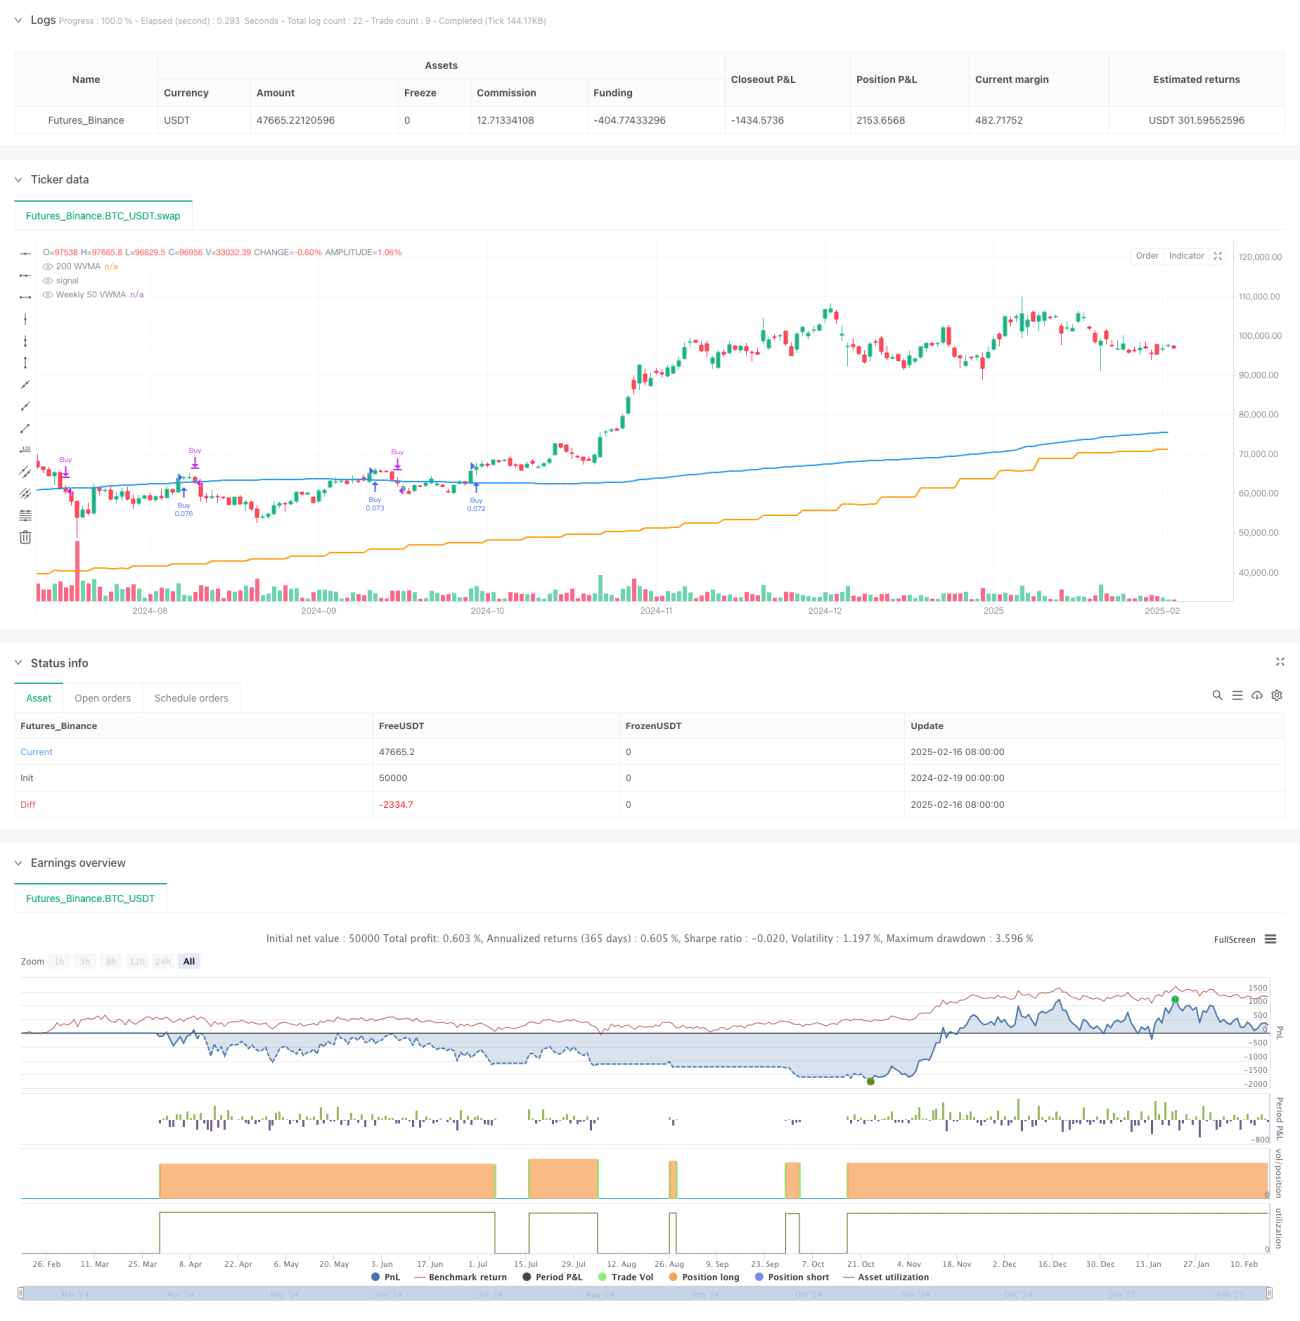
Strategi ini adalah sistem pengesanan trend berdasarkan tempoh masa berganda, menggabungkan purata bergerak berimbang 50 kitaran berganda ((VWMA) sebagai penapis trend besar, dan menggunakan 200 kitaran VWMA dan HLCC4 harga pecah dalam tempoh masa semasa sebagai isyarat perdagangan tertentu. Ini adalah strategi yang hanya melakukan lebih banyak, meningkatkan kebolehpercayaan perdagangan dengan pengesahan trend yang ketat dan pengesahan tempoh masa berganda.
Prinsip Strategi
Logik teras strategi ini merangkumi beberapa elemen penting:
- Menggunakan garis lingkaran 50 VWMA sebagai kriteria untuk menilai trend besar, hanya apabila harga berada di atas garis rata-rata ini, ia dibenarkan untuk membuka kedudukan.
- Syarat kemasukan memerlukan memenuhi kedua-dua harga penutupan K baris berturut-turut di atas 200 kitaran VWMA, dan harga penutupan K baris kedua lebih tinggi daripada HLCC4 rata-rata K baris pertama.
- Isyarat keluar berdasarkan tahap garisan hari, harga penutupan garisan hari jatuh di bawah garisan hari 200 kitaran VWMA dan menetap.
- Strategi ini menggunakan pengurusan kedudukan tetap, dengan setiap transaksi menggunakan 10% daripada kepentingan hak akaun.
- Tempoh tempoh mingguan yang dirangkai dalam tempoh 5 tahun yang lalu untuk memastikan kebolehgunaan strategi dalam keadaan pasaran terkini.
Kelebihan Strategik
- Pemverifikasi kitaran masa berganda: Dengan gabungan garis pusingan dan garis matahari, anda dapat memahami trend besar dan bertindak balas terhadap perubahan pasaran tepat pada masanya.
- Pengendalian risiko yang sempurna: penggunaan VWMA sebagai pengganti purata bergerak sederhana, dapat mencerminkan pergerakan sebenar pasaran dengan lebih baik.
- Pengesahan trend yang ketat: Memerlukan pelbagai syarat untuk masuk, mengurangkan risiko penembusan palsu
- Pengurusan kedudukan yang munasabah: Pengurusan kedudukan dengan peratusan tetap mengawal risiko dan mengekalkan ruang untuk keuntungan.
- Tingkat automasi yang tinggi: Strategi logik yang jelas, perdagangan automatik sepenuhnya boleh dilaksanakan.
Risiko Strategik
- Risiko trend reversal: Kemunculan pulangan yang lebih besar mungkin berlaku dalam keadaan pasaran yang bergolak.
- Kesan slippage: Harga transaksi sebenar mungkin menyimpang dari harga teori apabila pasaran kurang cair.
- Isyarat kelewatan: Kerana menggunakan garis rata-rata yang lebih lama, strategi mungkin bereaksi pada titik perubahan trend dengan kelewatan yang relatif.
- Risiko penembusan palsu: Walaupun terdapat banyak pengesahan, kerugian yang mungkin disebabkan oleh penembusan palsu masih boleh berlaku.
- Sekatan perdagangan satu arah: Strategi hanya melakukan lebih banyak, kehilangan peluang shorting yang berpotensi dalam trend menurun.
Arah pengoptimuman strategi
- Pengoptimuman parameter dinamik: parameter kitaran VWMA boleh disesuaikan secara automatik mengikut turun naik pasaran.
- Pengurusan kedudukan yang dioptimumkan: memperkenalkan sistem pengurusan kedudukan dinamik berdasarkan kadar turun naik.
- Peningkatan mekanisme keluar: boleh menambah hentian bergerak atau hentian dinamik berdasarkan petunjuk teknikal.
- Meningkatkan indikator sentimen pasaran: menggabungkan RSI atau MACD untuk meningkatkan kebolehpercayaan isyarat.
- Pengenalan analisis kuantiti urus niaga: analisis mendalam mengenai kuantiti urus niaga, kaedah pengiraan VWMA yang dioptimumkan.
ringkaskan
Ini adalah strategi pemantauan trend yang ketat yang dirancang, yang mencapai kawalan risiko yang lebih baik melalui kombinasi pelbagai kitaran masa dan syarat perdagangan yang ketat. Kelebihan utama strategi ini adalah mekanisme pengesahan trend yang sempurna dan logik perdagangan yang jelas, yang sesuai untuk merebut peluang trend jangka menengah dan panjang di pasaran yang kuat.
/*backtest
start: 2024-02-19 00:00:00
end: 2025-02-17 00:00:00
period: 1d
basePeriod: 1d
exchanges: [{"eid":"Futures_Binance","currency":"BTC_USDT"}]
*/

//@version=6
strategy("Long-Only 200 WVMA + HLCC4 Strategy (Weekly 50 VWMA Filter, Daily Exit, Last 5 Years)", overlay=true, default_qty_type=strategy.percent_of_equity, default_qty_value=10)

// Parameters- 1