
Gambaran keseluruhan
Strategi ini adalah sistem perdagangan yang mengesan trend berdasarkan Bollinger Bands dan Bollinger Bands. Strategi ini mengenal pasti isyarat perdagangan dengan mengenal pasti tiga Bollinger Bands yang berturut-turut, dan digabungkan dengan kedudukan harga penutupan dalam entiti Bollinger Bands. Sistem ini menggunakan nisbah risiko keuntungan 1: 1 yang tetap untuk menguruskan hentian dan hentian setiap perdagangan.
Prinsip Strategi
Logik teras strategi adalah berdasarkan elemen utama berikut:
- Menggunakan 20 kitaran pita Brin sebagai penunjuk utama, perkalian perbezaan standard adalah 2.0
- Syarat kemasukan berbilang kepala: tiga baris K berturut-turut harga penutupan menembusi landasan, dan ketiga-tiga baris K adalah garis yangar, harga penutupan terletak di bahagian atas entiti
- Syarat kemasukan kosong: tiga baris K berturut-turut harga penutupan menembusi ke bawah, dan ketiga-tiga baris K adalah cincin, harga penutupan terletak di bahagian bawah entiti
- Hentikan kerosakan pada garis K yang paling awal
- Rasio risiko-keuntungan berdasarkan 1:1 untuk menetapkan kedudukan berhenti
Kelebihan Strategik
- Menggunakan mekanisme pengesahan berganda untuk mengurangkan risiko penembusan palsu dengan syarat bentuk tiga penembusan K secara berturut-turut
- Pertimbangan kedudukan harga penutupan dalam entiti K-Line, meningkatkan kebolehpercayaan pengesahan trend
- Menguruskan kedudukan dengan menggunakan nisbah risiko dan ganjaran tetap untuk mengawal risiko
- Logik strategi adalah jelas, mudah difahami dan dilaksanakan
- Menunjukkan isyarat dagangan secara langsung melalui fungsi penanda untuk memudahkan analisis pengesanan semula
Risiko Strategik
- Isyarat palsu yang kerap mungkin berlaku dalam pasaran yang tidak menentu
- Rasio risiko-keuntungan tetap mungkin tidak dapat mengesan trend yang kuat
- Keperluan ketat untuk tiga K-line berturut-turut mungkin terlepas peluang yang berpotensi
- Penetapan hentikan pada nilai maksimum K-garis isyarat, kedudukan hentikan mungkin terlalu jauh jika turun naik yang besar
Ia disyorkan untuk menguruskan risiko dengan:
- Penyesuaian parameter Brin's Band dengan kitaran turun naik pasaran
- Pendapatan risiko yang disesuaikan dengan dinamika ciri pasaran
- Tambah penunjuk pengesahan arah aliran
- Mengoptimumkan kaedah penyetempatan kedudukan berhenti
Arah pengoptimuman strategi
- Optimasi parameter:
- Tempoh Burin dan perkalian perbezaan piawai boleh disesuaikan mengikut dinamik ciri-ciri pasaran yang berbeza
- Pertimbangkan untuk mengubah tiga garis K menjadi keputusan dinamik
- Pengoptimuman Isyarat:
- Tambah indikator pengesahan trend seperti ADX atau garis trend
- Memperkenalkan mekanisme pengesahan kuantiti
- Pertimbangkan untuk memasukkan penunjuk ayunan sebagai bantuan
- Pengurusan Posisi Optimum:
- Tetapan risiko-keuntungan yang dinamik
- Tambah modul pengurusan wang
- Mempertimbangkan mekanisme untuk membina dan memelihara gudang secara berturutan
- Pengoptimuman Stop Loss:
- Memperkenalkan mekanisme penghentian kehilangan
- Jarak hentian berdasarkan tetapan ATR
- Pertimbangkan masa yang terbuang
ringkaskan
Ini adalah strategi pengesanan trend yang berstruktur, logik dan jelas. Dengan mekanisme pengesahan pelbagai bentuk Bollinger Bands Breakout dan Thread, risiko isyarat palsu dikurangkan secara berkesan. Tetapan nisbah keuntungan risiko tetap menyederhanakan pengurusan perdagangan, tetapi juga mengehadkan fleksibiliti strategi.
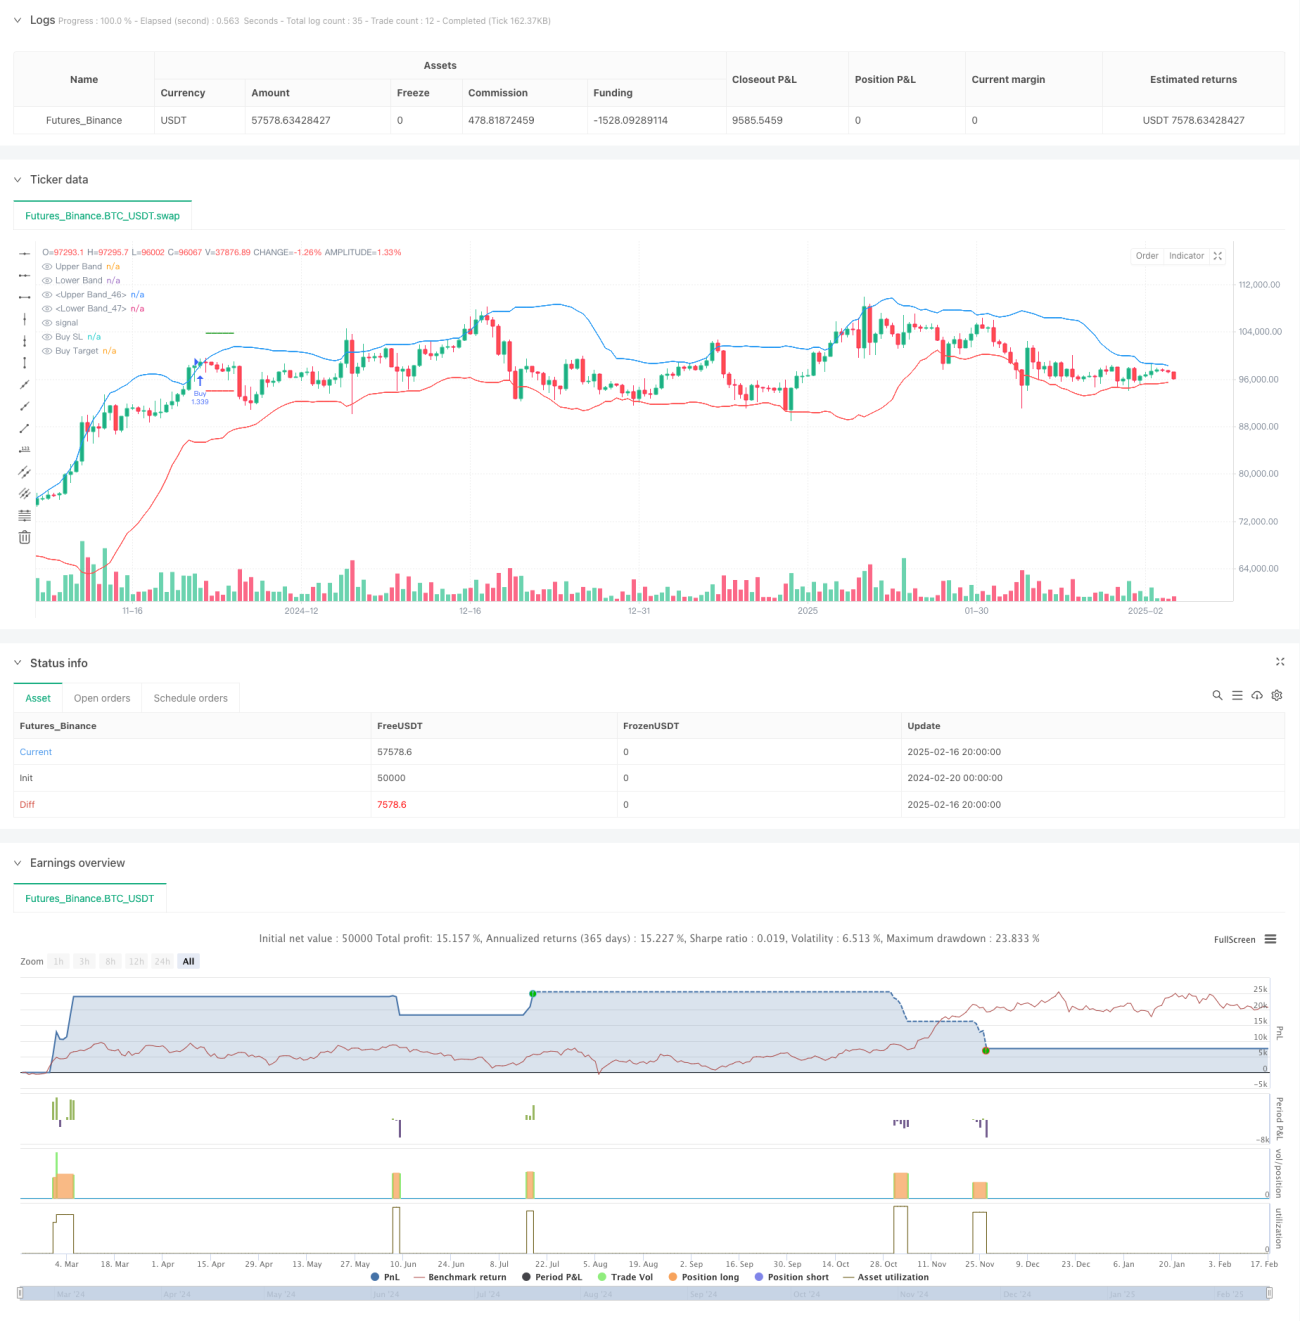
/*backtest
start: 2024-02-20 00:00:00
end: 2025-02-17 08:00:00
period: 12h
basePeriod: 12h
exchanges: [{"eid":"Futures_Binance","currency":"BTC_USDT"}]
*/

//@version=6
strategy("Bollinger Band Strategy (Close Near High/Low Relative to Half Range)", overlay=true, default_qty_type=strategy.percent_of_equity, default_qty_value=200, pyramiding=0)

// Bollinger Bands- 1