Gambaran keseluruhan
Strategi ini adalah sistem perdagangan trend-tracking yang menggabungkan pelbagai petunjuk teknikal. Ia adalah berdasarkan pada isyarat silang purata bergerak sederhana (SMA) dan purata bergerak indeks (EMA) dan menggabungkan beberapa ciri canggih seperti jalur trend HMA, indikator William (%R), analisis titik rendah dan tinggi berayun, untuk memberikan isyarat perdagangan yang lebih dipercayai melalui mekanisme penapisan dinamik.
Prinsip Strategi
Logik utama strategi ini adalah berdasarkan kepada beberapa elemen utama:
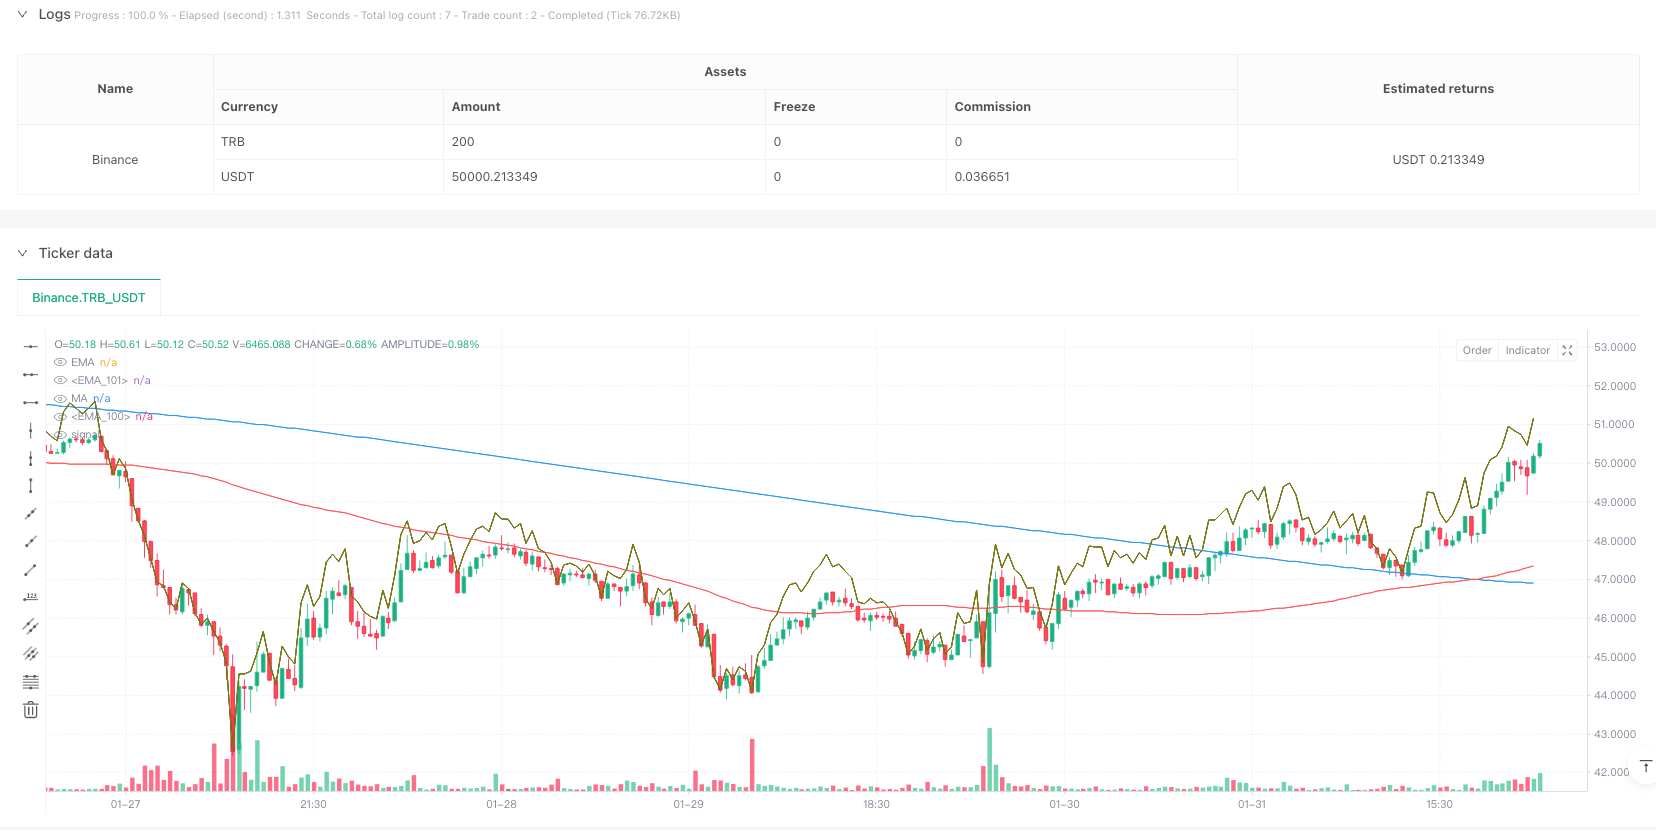
- Menggunakan SMA 100 dan EMA 200 sebagai penanda utama trend
- HMA trend band yang mengintegrasikan 70 kitaran digunakan untuk mengesahkan pergerakan trend
- Pengiraan bit sokongan / rintangan dinamik menggunakan indikator William ((% R)
- Pengesanan tetingkap pengulangan 20 kitaran untuk mendedahkan titik-titik rendah dan tinggi
- Pemantauan dan kemas kini dalam masa nyata
- Tetapkan penapisan awal bukaan dan paras turun naik (<0.5%) untuk mengurangkan isyarat palsu
Syarat kemasukan mesti dipenuhi pada masa yang sama: garis rata-rata ganda di stesen harga, indikator% R meningkat 3 garis K berturut-turut dan lebih besar daripada-20, garis K ditutup dan harga penutupan lebih tinggi daripada yang sebelumnya, harga tidak melebihi nilai turun naik dalam sehari. Syarat keluar memenuhi salah satu daripada syarat berikut: harga jatuh di bawah garis tengah ganda, indikator %R di bawah -80
Kelebihan Strategik
- Pengesahan serentak pelbagai petunjuk teknikal meningkatkan kebolehpercayaan isyarat perdagangan
- Mekanisme penapisan dinamik berkesan mengurangkan isyarat palsu pada masa lonjakan
- Pengiraan rintangan sokongan yang menyesuaikan diri menjadikan strategi ini beradaptasi dengan pasaran
- Mekanisme pengurusan dagangan dalam sehari yang lengkap, termasuk penapisan awal buka dan kawalan nilai terhad turun naik
- Parameter yang boleh disesuaikan, mudah dioptimumkan mengikut keadaan pasaran yang berbeza
Risiko Strategik
- Sistem garis rata mungkin menghasilkan isyarat palsu yang kerap berlaku dalam pasaran yang bergolak
- Penyaringan pelbagai syarat mungkin menyebabkan kehilangan peluang dagangan yang berpotensi
- Tempoh purata bergerak tetap mungkin berbeza dalam keadaan pasaran yang berbeza
- Mekanisme penapisan dagangan dalam hari mungkin terlepas peluang penting dalam keadaan trend pesat.
- Parameter yang terlalu optimum boleh menyebabkan masalah overfitting
Arah pengoptimuman strategi
- Memperkenalkan mekanisme pengiraan kitaran linear yang beradaptasi sendiri untuk membolehkan sistem lebih beradaptasi dengan turun naik pasaran
- Meningkatkan penunjuk analisis kuantiti transaksi untuk meningkatkan kebolehpercayaan pengesahan trend
- Membangunkan mekanisme penangguhan kerugian yang dinamik untuk meningkatkan kecekapan pengurusan dana
- Penambahan penunjuk kadar turun naik pasaran, penyetempatan nilai had untuk mengoptimumkan keadaan penapisan
- Mengambil kira sinkronisasi isyarat dalam tempoh masa yang berbeza, meningkatkan kestabilan sistem
ringkaskan
Ini adalah sistem perdagangan pengesanan trend yang direka dengan baik, yang mengekalkan fleksibiliti yang baik sambil memastikan kebolehpercayaan melalui penyepaduan pelbagai petunjuk teknikal dan mekanisme penapisan yang ketat. Ruang pengoptimuman strategi adalah terutamanya dalam penyesuaian parameter dan penyempurnaan mekanisme pengurusan risiko.
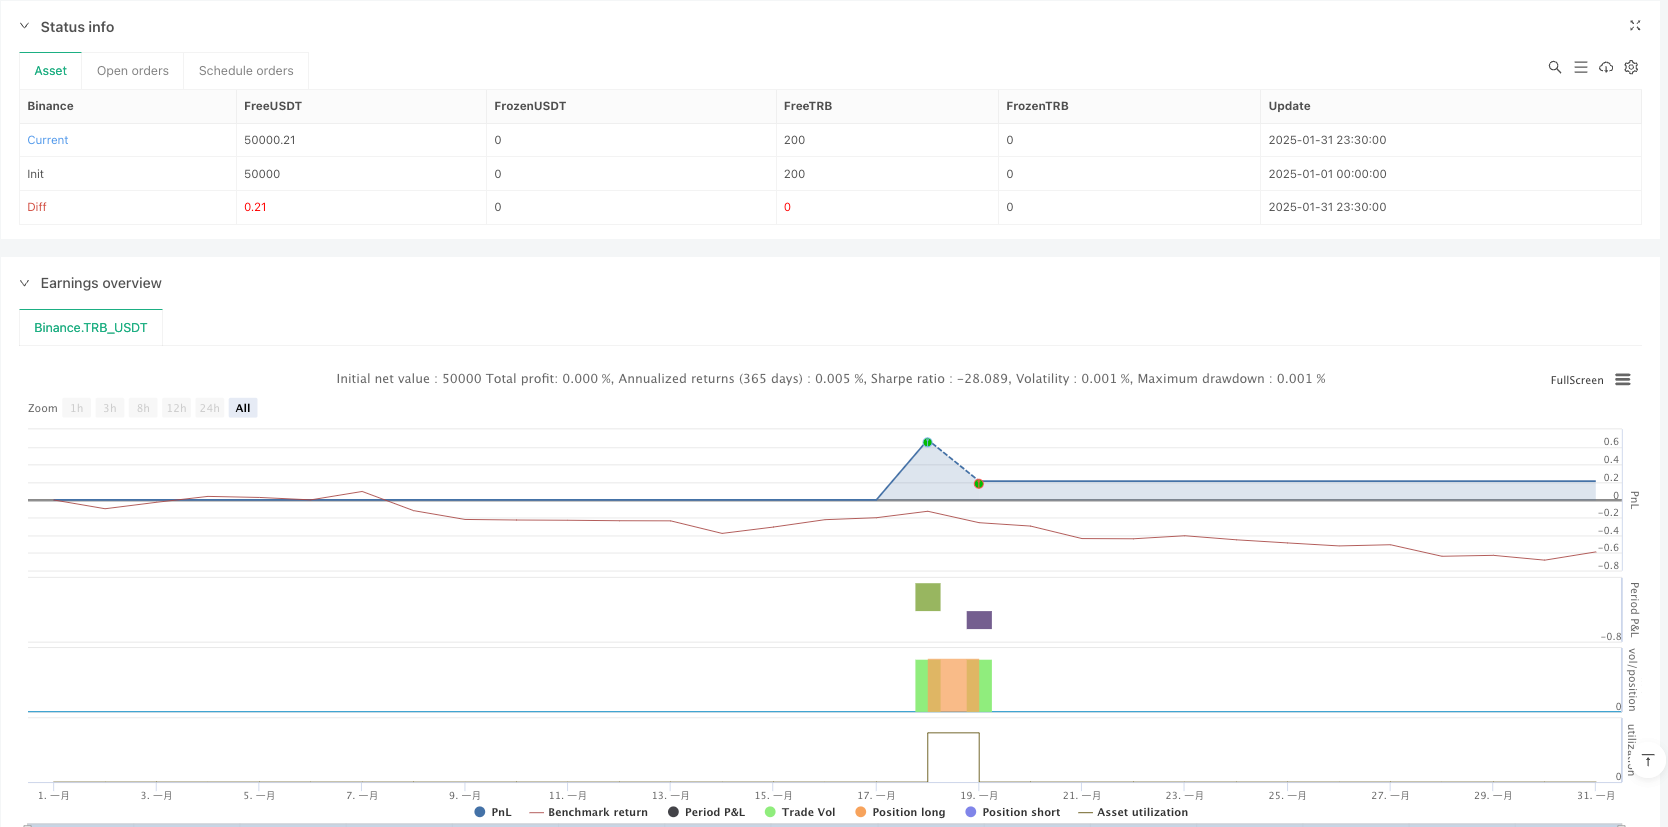
/*backtest
start: 2025-01-01 00:00:00
end: 2025-01-31 23:59:59
period: 30m
basePeriod: 30m
exchanges: [{"eid":"Binance","currency":"TRB_USDT"}]
*/

//@version=5
strategy(title="EMA & MA Crossover Strategy", shorttitle="EMA & MA Crossover Strategy", overlay=true)

// Inputs
LengthMA = input.int(100, minval=1, title="MA Length")
LengthEMA = input.int(200, minval=1, title="EMA Length")
swingLookback = input.int(20, title="Swing Lookback")
Lengthhmaribbon = input.int(70, minval=1, title="HMA Ribbon")
// Input for ignoring the first `n` candles of the day
ignore_n_candles = input.int(1, "Ignore First N Candles", minval=0)
// Input for percentage threshold to ignore high run-up candles
run_up_threshold = input.float(0.5, "Run-up Threshold (%)", minval=0.0)

//====================================================================
hmacondition = ta.hma(close,Lengthhmaribbon)> ta.hma(close,Lengthhmaribbon)[1]

//====================================================================
// Function to drop the first `n` candles
dropn(src, n) =>
    na(src[n]) ? na : src

// Request data with the first `n` candles dropped
valid_candle = not na(dropn(close, ignore_n_candles))
// Check for run-up condition on the previous candle
prev_run_up = (high[1] - low[1]) / low[1] * 100

// Combine conditions: exclude invalid candles and ignore high run-up candles
valid_entry_condition = valid_candle and prev_run_up <= run_up_threshold

//======================================================
// Define the start of a new day based on time
var is_first = false
var float day_high = na
var float day_low = na

// Use time() to detect the start of a new day
t = time("1440") // 1440 = 60 * 24 (one full day in minutes)
is_first := na(t[1]) and not na(t) or t[1] < t

if is_first and barstate.isnew
    day_high := high
    day_low := low
else
    day_high := nz(day_high[1], high)
    day_low := nz(day_low[1], low)

// Update daily high and low
if high > day_high
    day_high := high

if low < day_low
    day_low := low

//====================================================
previousdayclose = request.security(syminfo.tickerid, "D", close)

day_highrange = previousdayclose*.018
//======================================================
length = input(title="Length", defval=14)
src = input(close, "Source")
_pr(length) =>
	max = ta.highest(length)
	min = ta.lowest(length)
	100 * (src - max) / (max - min)
percentR = _pr(length)

//======================================================
higherline = close* 1+((100-(percentR*-1))/100)
lowerline = close* 1-((100-(percentR*-1))/100)
//======================================================
// Moving Averages
xMA = ta.sma(close, LengthMA)
xEMA = ta.sma(xMA, LengthEMA)

// Plot the MA and EMA lines
plot(xMA, color=color.red, title="MA")
plot(xEMA, color=color.blue, title="EMA")

// Find recent swing high and low
recentHigh = ta.highest(high, swingLookback)
recentLow = ta.lowest(low, swingLookback)
//===============================================
emacondition = ta.ema(close,20)>ta.ema(close,30) and ta.ema(close,30)>ta.ema(close,40) and ta.ema(close,40)>ta.ema(close,50) and close >ta.ema(close,20)
// Define Buy Condition
buyCondition1 = (percentR>percentR[1] and percentR[1]>percentR[2] and percentR[2]>percentR[3]) and percentR>-20 and percentR[1]>-20
buyCondition = (close> xMA and close> xEMA) and (close > open and close > close[1]) or xMA>xEMA and close<day_highrange and hmacondition and emacondition

// Define Sell Conditions
sellCondition = (close < xMA and close < xEMA) or xMA<xEMA or percentR<-80

// Strategy Execution
if (buyCondition and buyCondition1 and valid_entry_condition)
    strategy.entry("Buy", strategy.long)

if (sellCondition)
    strategy.close("Buy")  // Close the long position

// Candle coloring for buy/sell indication
barcolor(buyCondition ? color.green : sellCondition ? color.red : na)
plot(higherline, color=color.olive, title="EMA")
plot(higherline, color=color.black, title="EMA")