Gambaran keseluruhan
Strategi ini adalah sistem perdagangan komprehensif berdasarkan analisis teknikal, yang menggabungkan kawasan sokongan rintangan, corak grafik dan analisis struktur pasaran. Strategi ini membuat keputusan perdagangan dengan mengenal pasti tahap harga penting, mengesahkan isyarat grafik, dan menilai trend pasaran keseluruhan. Sistem ini menggunakan nisbah keuntungan risiko 1: 3 untuk menguruskan risiko dengan tujuan berhenti dan keuntungan yang ditetapkan.
Prinsip Strategi
Logik utama strategi ini adalah berdasarkan beberapa komponen utama:
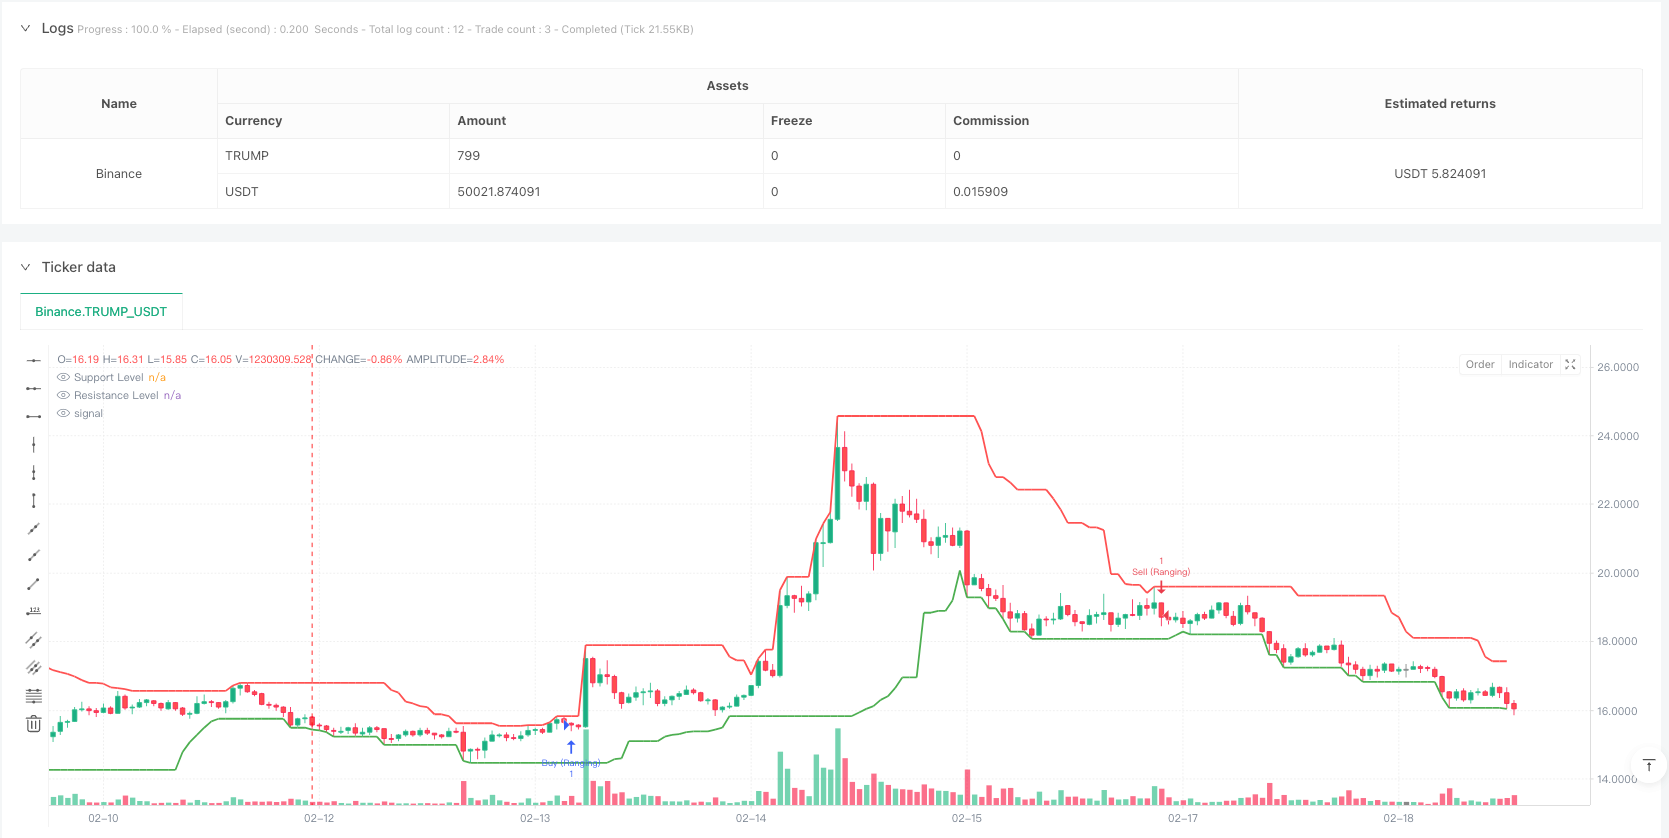
- Pengenalan zon sokongan dan rintangan - menggunakan harga tertinggi dan terendah dalam 20 kitaran terakhir untuk menentukan tahap harga kritikal
- Pengesahan corak grafik - termasuk corak tipikal seperti pencelupan bullish, pencelupan bearish, garisan kelinci dan garisan meteor
- Analisis struktur pasaran - menilai apakah pasaran berada dalam trend naik, turun, atau bergolak dengan membandingkan siri titik tinggi dan rendah
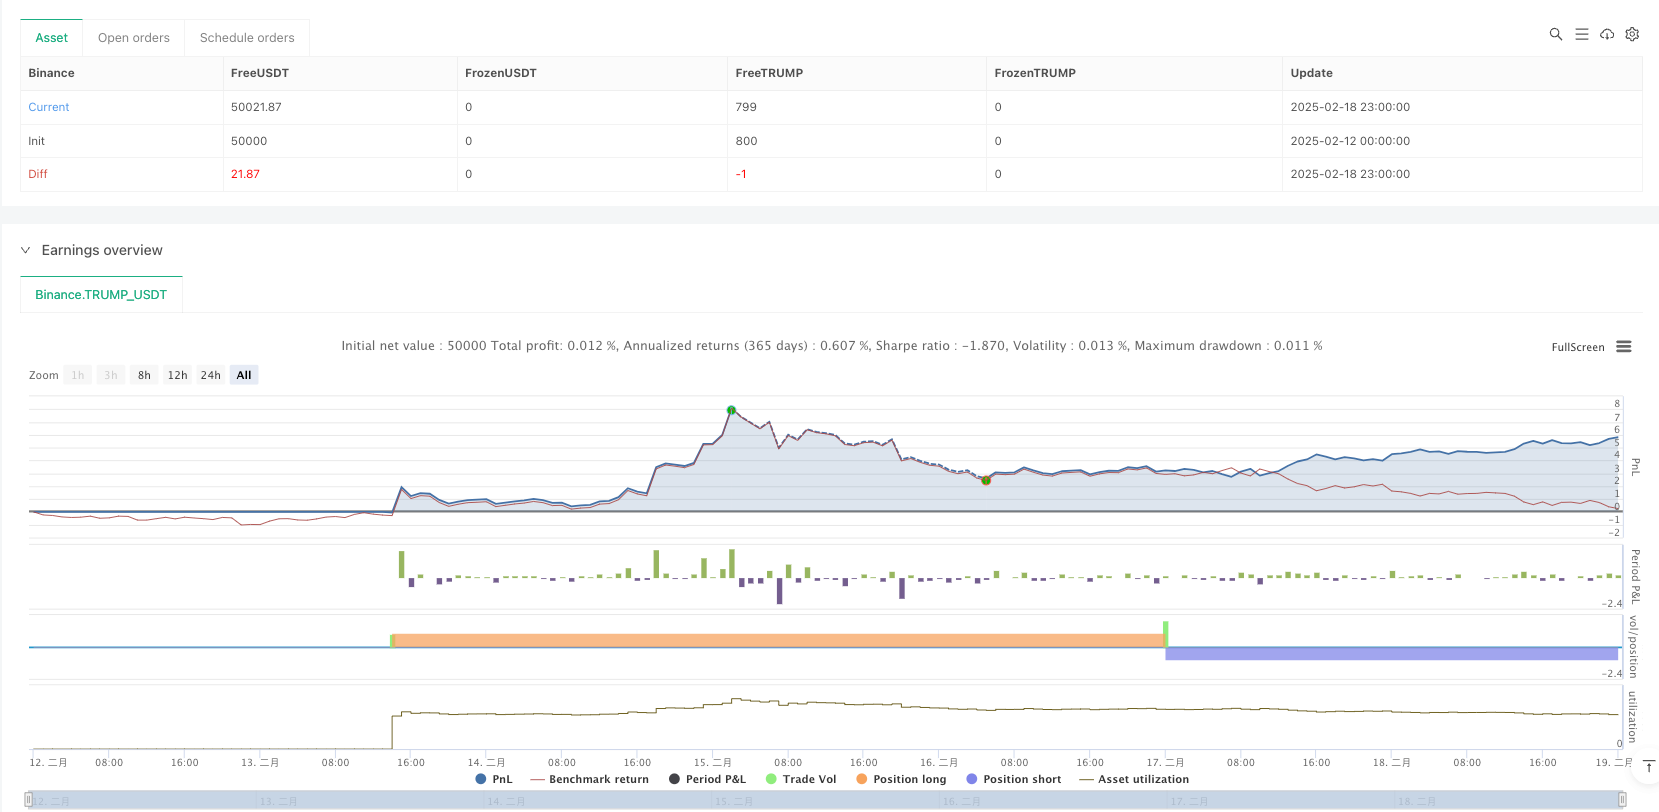
- Pengurusan risiko - menetapkan kedudukan henti dengan titik berhenti tetap dan nisbah risiko keuntungan 1: 3
Strategi ini berfungsi dalam tiga jenis persekitaran pasaran: pasaran trend, pasaran selang, dan pasaran beralih, tetapi menggunakan kombinasi peraturan perdagangan yang berbeza untuk setiap persekitaran.
Kelebihan Strategik
- Analisis pelbagai dimensi - menyediakan isyarat dagangan yang lebih dipercayai dengan mengintegrasikan tahap harga, corak grafik dan struktur pasaran
- Adaptif - mampu menyesuaikan diri dengan keadaan pasaran yang berbeza, termasuk trend dan selang
- Pengurusan risiko yang baik - menggunakan nisbah risiko dan ganjaran yang tetap, memastikan bahawa setiap perdagangan mempunyai kawalan risiko yang jelas
- Sokongan visual - Membantu kawasan rintangan dengan penanda grafik untuk memudahkan peniaga memahami keadaan pasaran
Risiko Strategik
- Risiko penembusan palsu - harga mungkin berundur dengan cepat selepas penembusan, menghasilkan isyarat palsu
- Risiko slippage - harga transaksi sebenar mungkin lebih jauh daripada yang dijangkakan dalam tempoh turun naik yang kuat
- Sensitiviti parameter - pilihan parameter seperti kitaran rintangan sokongan, kitaran struktur pasaran akan mempengaruhi prestasi strategi dengan ketara
- Ketergantungan kepada keadaan pasaran - mungkin kurang baik dalam pergerakan satu arah yang cepat atau pasaran yang bergolak
Arah pengoptimuman strategi
- Penyesuaian parameter dinamik - kitaran pengiraan untuk kawasan sokongan dan rintangan yang disesuaikan secara automatik mengikut turun naik pasaran
- Penguatan penapis - penambahan penunjuk seperti jumlah lalu lintas, kadar turun naik untuk menapis isyarat penembusan palsu
- Pengoptimuman Hentikan Kerosakan - mewujudkan tetapan Hentikan Kerosakan dinamik berasaskan ATR untuk meningkatkan daya serap terhadap turun naik pasaran
- Pengesahan bingkai masa - memperkenalkan analisis bingkai masa berbilang untuk meningkatkan kebolehpercayaan isyarat
- Pengurusan kedudukan yang dioptimumkan - menyesuaikan saiz pegangan secara dinamik berdasarkan turun naik pasaran dan kekuatan isyarat
ringkaskan
Strategi ini membina sistem perdagangan yang lengkap dengan menggunakan pelbagai alat analisis teknikal secara komposit. Kelebihannya adalah analisis pelbagai dimensi dan pengurusan risiko yang baik, tetapi ia juga menghadapi cabaran seperti penembusan palsu dan kepekaan parameter. Dengan arah pengoptimuman yang dicadangkan, strategi ini dijangka meningkatkan kestabilan dan kesesuaian lebih lanjut dengan mengekalkan kelebihan sedia ada.
/*backtest
start: 2025-02-12 00:00:00
end: 2025-02-19 00:00:00
period: 1h
basePeriod: 1h
exchanges: [{"eid":"Binance","currency":"TRUMP_USDT"}]
*/

//@version=5
strategy("Support/Resistance Strategy with Candlestick Confirmation, Market Structure, and 1:3 R:R", overlay=true)

// Input parameters
supportResistancePeriod = input.int(20, title="Support/Resistance Period", minval=1)
stopLossPips = input.int(50, title="Stop Loss (in pips)", minval=1)
takeProfitRatio = input.float(3.0, title="Risk-to-Reward Ratio", minval=1.0)
structurePeriod = input.int(20, title="Market Structure Period", minval=1)  // Period to determine market structure

// Function to calculate support level (lowest low in the period)
getSupportLevel() =>
    ta.lowest(low, supportResistancePeriod)

// Function to calculate resistance level (highest high in the period)
getResistanceLevel() =>
    ta.highest(high, supportResistancePeriod)

// Get the support and resistance levels
supportLevel = getSupportLevel()
resistanceLevel = getResistanceLevel()

// Function to detect market structure
isBullishTrend() =>
    high[structurePeriod] > high[structurePeriod+1] and low[structurePeriod] > low[structurePeriod+1]

isBearishTrend() =>
    high[structurePeriod] < high[structurePeriod+1] and low[structurePeriod] < low[structurePeriod+1]

isRanging() =>
    not isBullishTrend() and not isBearishTrend()

// Candlestick Pattern Detection Functions
isBullishEngulfing() =>
    close[1] < open[1] and close > open and close > open[1] and open < close[1]

isBearishEngulfing() =>
    close[1] > open[1] and close < open and close < open[1] and open > close[1]

isDoji() =>
    math.abs(close - open) <= (high - low) * 0.1

isHammer() =>
    body = math.abs(close - open)
    upperShadow = high - math.max(close, open)
    lowerShadow = math.min(close, open) - low
    body <= (high - low) * 0.3 and lowerShadow > body * 2 and upperShadow <= body * 0.5

isShootingStar() =>
    body = math.abs(close - open)
    upperShadow = high - math.max(close, open)
    lowerShadow = math.min(close, open) - low
    body <= (high - low) * 0.3 and upperShadow > body * 2 and lowerShadow <= body * 0.5

// Conditions for Buy and Sell based on candle close
buyCondition = (isBullishEngulfing() or isHammer()) and close > supportLevel
sellCondition = (isBearishEngulfing() or isShootingStar()) and close < resistanceLevel

// Define buy/sell conditions based on market structure
bullishMarket = isBullishTrend() and buyCondition
bearishMarket = isBearishTrend() and sellCondition
rangingMarket = isRanging() and (buyCondition or sellCondition)

// Calculate the Stop Loss and Take Profit Levels
longStopLoss = supportLevel - (stopLossPips * syminfo.mintick)
shortStopLoss = resistanceLevel + (stopLossPips * syminfo.mintick)

// Calculate R:R based Take Profit Levels
longTakeProfit = close + (math.abs(close - longStopLoss) * takeProfitRatio)
shortTakeProfit = close - (math.abs(close - shortStopLoss) * takeProfitRatio)

// Plotting Support and Resistance Lines
plot(supportLevel, color=color.green, linewidth=2, title="Support Level", style=plot.style_line)
plot(resistanceLevel, color=color.red, linewidth=2, title="Resistance Level", style=plot.style_line)

// Strategy: Buy on Support, Sell on Resistance with candlestick confirmation and market structure
if (bullishMarket)
    strategy.entry("Buy", strategy.long, stop=longStopLoss, limit=longTakeProfit)

if (bearishMarket)
    strategy.entry("Sell", strategy.short, stop=shortStopLoss, limit=shortTakeProfit)

if (rangingMarket)
    if (buyCondition)
        strategy.entry("Buy (Ranging)", strategy.long, stop=longStopLoss, limit=longTakeProfit)
    if (sellCondition)
        strategy.entry("Sell (Ranging)", strategy.short, stop=shortStopLoss, limit=shortTakeProfit)

// Optional: Highlighting the zones for support and resistance
bgcolor(close > resistanceLevel ? color.new(color.red, 90) : na, title="Resistance Zone")
bgcolor(close < supportLevel ? color.new(color.green, 90) : na, title="Support Zone")