Penjejakan aliran berbilang tempoh dan strategi pengesahan volum

2
Follow
478
Followers
Gambaran keseluruhan
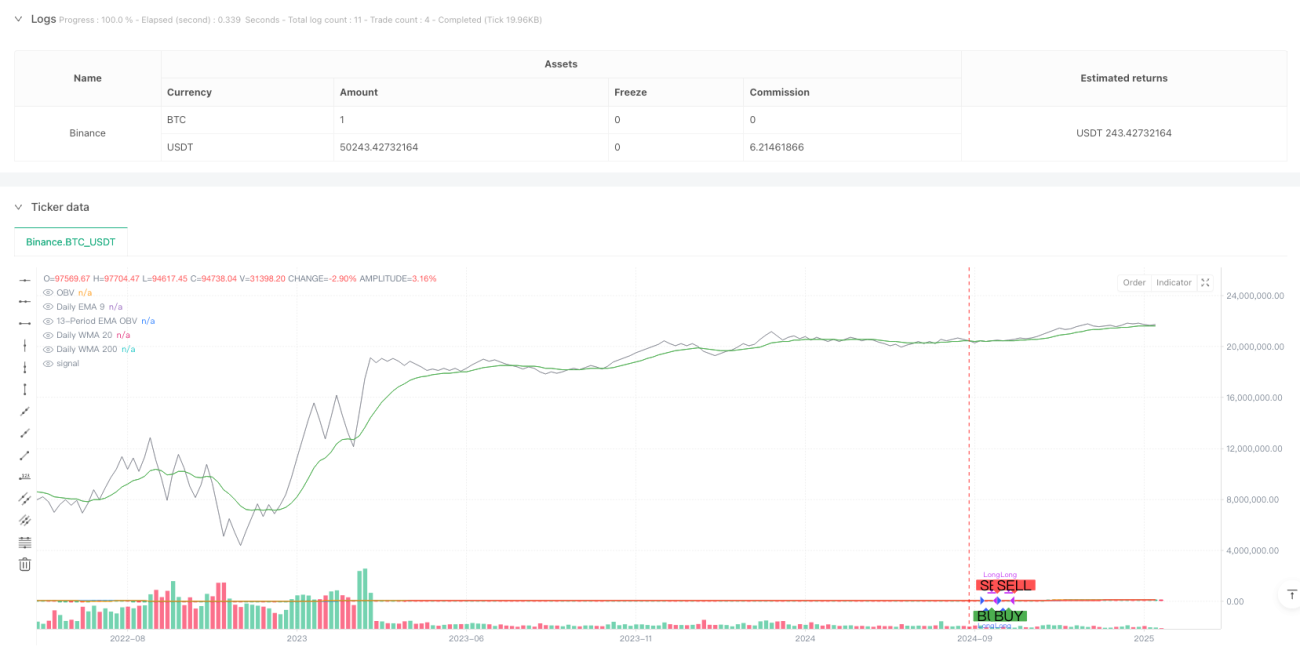
Strategi ini adalah sistem pengesanan trend yang menggabungkan purata bergerak berkala dan analisis kuantiti transaksi. Strategi ini mengesahkan trend keseluruhan melalui tiga garis rata EMA9, WMA20 dan WMA200 dalam kitaran sunset, sambil memperkenalkan indikator OBV ((On Balance Volume) dan EMA untuk mengesahkan jumlah transaksi, untuk mencapai perdagangan yang lebih stabil.
Prinsip Strategi
Strategi ini berfungsi berdasarkan dua syarat utama:
- Pengesahan trend - Mengesahkan arah trend dengan menilai sama ada tiga garis harian (EMA9, WMA20, WMA200) berada dalam keadaan naik. Apabila tiga garis rata-rata condong ke atas, menunjukkan bahawa setiap tempoh masa menunjukkan trend berbilang kepala.
- Pengesahan kuantiti transaksi - Analisis kuantiti transaksi menggunakan indikator OBV dan EMA 13 kitaran. Apabila EMA OBV berada di atas OBV, menunjukkan kenaikan harga sokongan kuantiti transaksi, mengesahkan kesahihan trend.
Strategi hanya akan menghasilkan isyarat ganda jika kedua-dua syarat ini dipenuhi secara serentak. Strategi akan keluar dengan rata jika salah satu syarat tidak dipenuhi.
Kelebihan Strategik
- Analisis pelbagai bingkai masa - mengurangkan risiko penembusan palsu dengan mempertimbangkan trend jangka pendek (EMA9), jangka menengah (WMA20) dan jangka panjang (WMA200) secara menyeluruh.
- Sokongan jumlah pesanan - memperkenalkan analisis indikator OBV untuk memastikan pergerakan harga mendapat sokongan jumlah pesanan.
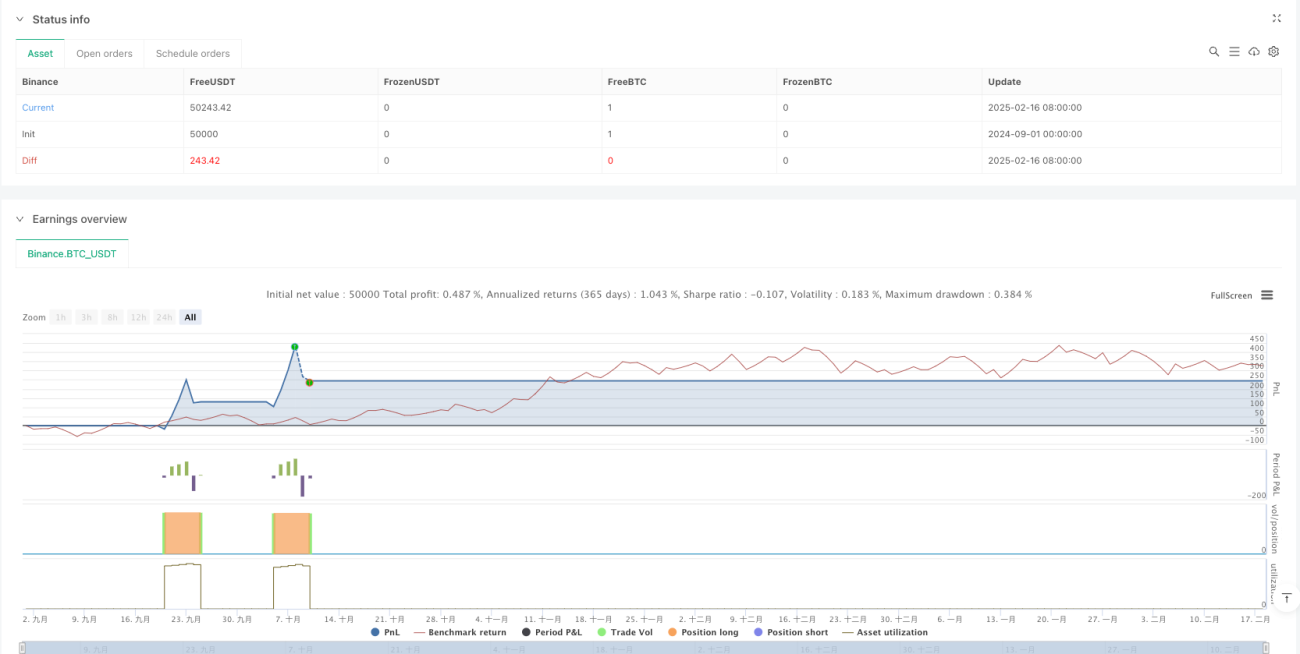
- Kawalan risiko yang sempurna - Mengambil kira peratusan pengurusan kedudukan dan bayaran, lebih sesuai dengan persekitaran perdagangan sebenar.
- Sokongan visual - Membantu peniaga memahami masa masuk dan keluar dengan tanda grafik yang jelas.
Risiko Strategik
- Penundaan pembalikan trend - Mungkin reaksi lambat pada permulaan pembalikan trend kerana penggunaan pengesahan garis rata-rata berbilang.
- Pasaran goyah tidak boleh digunakan - dalam fasa penyusunan bertaburan, penembusan palsu yang kerap boleh menyebabkan terlalu banyak perdagangan.
- Pertimbangan kos modal - bayaran 0.1% boleh menjejaskan keuntungan secara ketara dalam perdagangan frekuensi tinggi.
Arah pengoptimuman strategi
- Memperkenalkan penunjuk turun naik - penambahan penunjuk turun naik seperti ATR boleh dipertimbangkan untuk menyesuaikan kedudukan secara dinamik dalam keadaan pasaran yang berbeza.
- Peningkatan mekanisme henti rugi - disyorkan untuk menambah fungsi henti rugi untuk lebih melindungi keuntungan.
- Penapis keadaan pasaran - penambahan indikator penilaian keadaan pasaran untuk mengurangkan frekuensi perdagangan atau menghentikan perdagangan di pasaran yang bergolak.
- Pilihan parameter pengoptimuman - Pertimbangkan untuk mengoptimumkan kitaran purata dan parameter OBV untuk pelbagai pasaran dan varieti.
ringkaskan
Strategi ini, dengan menggabungkan analisis trend pelbagai kitaran dan pengesahan kuantiti transaksi, membina sistem pengesanan trend yang agak lengkap. Logik strategi jelas, kawalan risiko masuk akal, tetapi masih ada ruang untuk pengoptimuman.
Source
Pine
/*backtest
start: 2024-09-01 00:00:00
end: 2025-02-18 08:00:00
period: 5d
basePeriod: 5d
exchanges: [{"eid":"Binance","currency":"BTC_USDT"}]
*/

//@version=6
strategy("Strategy: Daily MAs + OBV", overlay=true, initial_capital=10000, default_qty_type=strategy.percent_of_equity, default_qty_value=10, commission_type=strategy.commission.percent, commission_value=0.1)

//=== Daily Moving Averages Calculation =========================Related strategies
Comment
All comments (0)
No data
- 1