Strategi silang berbilang penunjuk adaptif dinamik digabungkan dengan sistem kawalan risiko pintar SRSI dan MACD

Gambaran keseluruhan
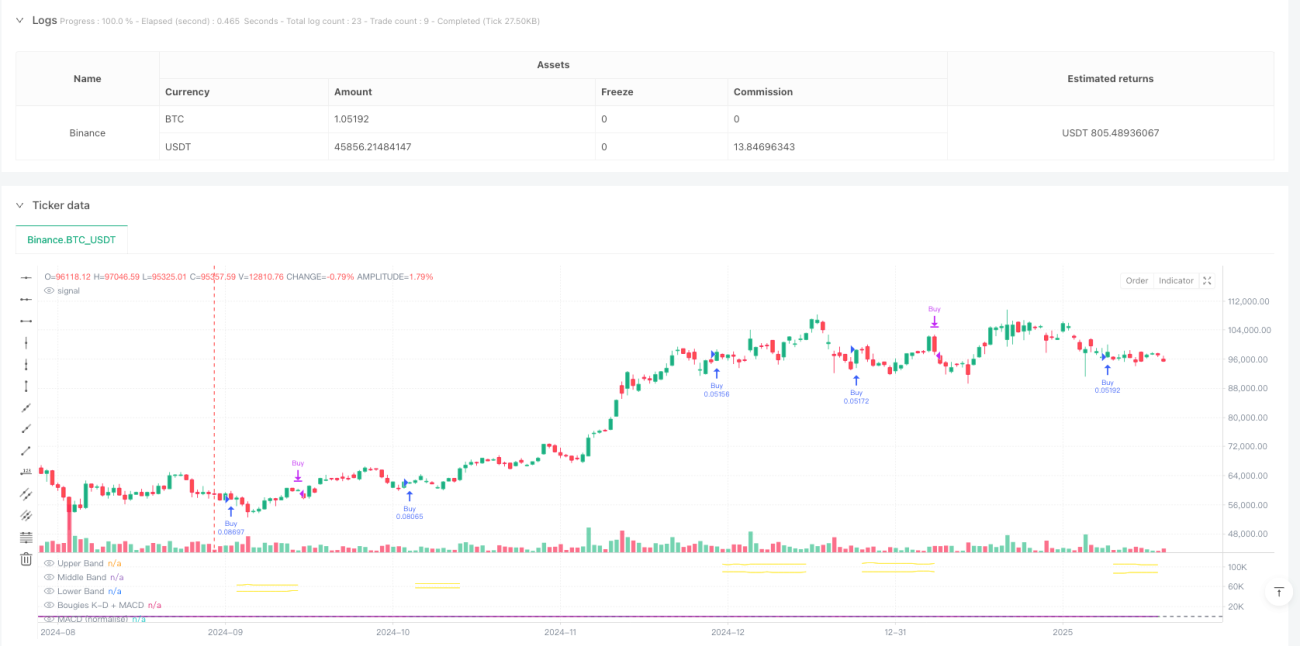
Strategi ini adalah sistem perdagangan dinamik yang menggabungkan indikator acak yang agak kuat ((SRSI) dan indikator pergerakan rata-rata trend / penyebaran ((MACD)). Ia secara dinamik menyesuaikan titik-titik berhenti dan titik-titik berhenti melalui indikator ATR, mewujudkan pengurusan risiko yang cerdas. Inti strategi ini adalah untuk menghasilkan isyarat perdagangan melalui pengesahan silang pelbagai indikator teknikal, sambil menguruskan kedudukan yang berkaitan dengan turun naik pasaran.
Prinsip Strategi
Strategi ini adalah berdasarkan kepada beberapa mekanisme utama:
- Perbezaan antara garis K dan garis D dalam SRSI, dan perbezaan antara garis K dan MACD yang direduksi untuk menentukan pergerakan pasaran
- Syarat pembelian perlu dipenuhi pada masa yang sama: perbezaan K-D adalah positif, perbezaan K-MACD adalah positif, dan MACD tidak berada dalam trend menurun
- Syarat menjual perlu dipenuhi pada masa yang sama: K-D adalah negatif, K-MACD adalah negatif, dan MACD tidak dalam trend naik
- Menggunakan ATR kalikan dengan faktor risiko untuk mengira jarak berhenti dan berhenti secara dinamik, menyesuaikan diri dengan turun naik pasaran
Kelebihan Strategik
- Mekanisme pengesahan pelbagai isyarat meningkatkan kebolehpercayaan dagangan dengan ketara, mengelakkan isyarat palsu yang mungkin dibawa oleh satu petunjuk
- Tetapan stop loss yang dinamik dapat disesuaikan secara automatik dengan turun naik pasaran, memberikan nisbah risiko-keuntungan yang lebih baik
- Strategi mempunyai kebolehsuaian yang baik dan dapat mengekalkan prestasi yang stabil dalam keadaan pasaran yang berbeza
- Parameter yang boleh laras, membolehkan peniaga untuk mengoptimumkan mengikut pilihan risiko peribadi
Risiko Strategik
- Terlalu banyak isyarat dagangan yang mungkin dihasilkan dalam pasaran yang bergolak, menyebabkan masuk dan keluar pasaran yang kerap
- Penggunaan pelbagai petunjuk boleh menyebabkan isyarat terlewat, kehilangan peluang terbaik untuk memasuki pasaran yang berubah dengan cepat
- ATR berdasarkan kepada kadar turun naik sejarah dan mungkin tidak dapat disesuaikan dengan kadar turun naik pasaran
- Perlu menetapkan faktor risiko yang munasabah, terlalu besar atau terlalu kecil boleh mempengaruhi keberkesanan strategi
Arah pengoptimuman strategi
- Menambah penapis trend, menggunakan kriteria pengesahan isyarat yang berbeza di pasaran goyah dan pasaran trend
- Memperkenalkan penunjuk jumlah lalu lintas sebagai pengesahan tambahan untuk meningkatkan kebolehpercayaan isyarat
- Kaedah pengiraan untuk mengoptimumkan stop loss yang boleh dipertimbangkan dengan sokongan resistance
- Menambah model ramalan kadar turun naik pasaran, menyesuaikan parameter risiko lebih awal
- Pertimbangkan untuk mengesahkan isyarat pada kitaran masa yang berbeza untuk meningkatkan kestabilan strategi
ringkaskan
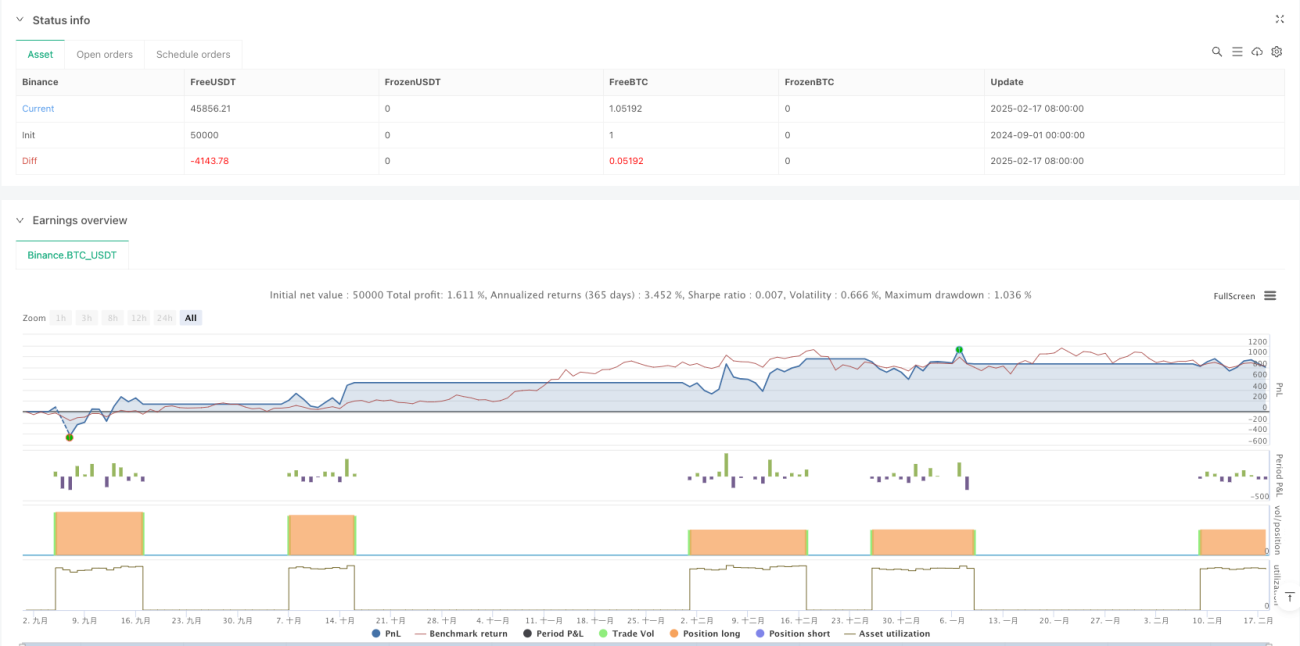
Strategi ini membina sistem perdagangan yang mantap dengan menggabungkan kelebihan SRSI dan MACD. Mekanisme pengurusan risiko dinamik menjadikannya beradaptasi dengan baik, tetapi masih memerlukan pengurus untuk mengoptimumkan parameter berdasarkan keadaan pasaran sebenar.
/*backtest
start: 2024-09-01 00:00:00
end: 2025-02-18 08:00:00
period: 1d
basePeriod: 1d
exchanges: [{"eid":"Binance","currency":"BTC_USDT"}]
*/

//@version=6
strategy(title="SRSI + MACD Strategy with Dynamic Stop-Loss and Take-Profit", shorttitle="SRSI + MACD Strategy", overlay=false, default_qty_type=strategy.percent_of_equity, default_qty_value=10)

// User Inputs- 1