Sistem perdagangan mengikut arah aliran dengan trailing stop loss dinamik ATR

2
Follow
478
Followers
Gambaran keseluruhan
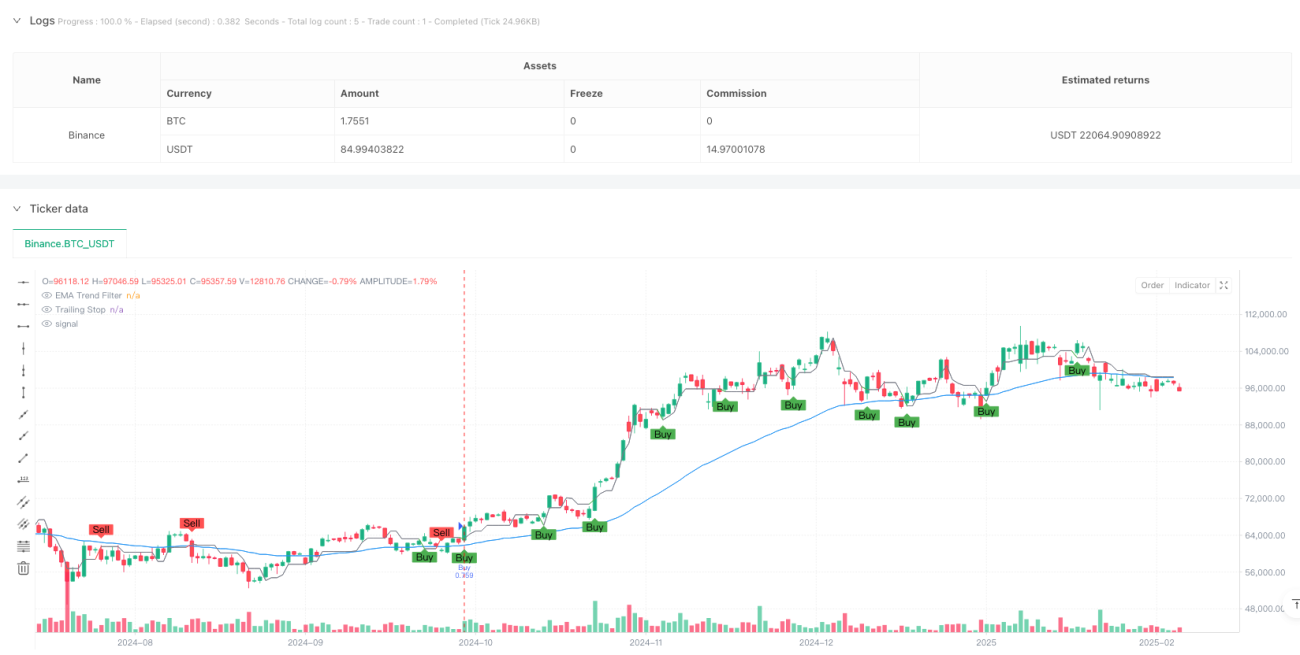
Strategi ini adalah sistem pengesanan trend yang secara dinamik menjejaki stop loss berdasarkan ATR (Average True Range). Ia menggabungkan garis rata-rata EMA sebagai penapis trend, dan mengawal penjanaan isyarat dengan menyesuaikan parameter sensitiviti dan kitaran ATR. Sistem ini menyokong bukan sahaja perdagangan lebih banyak, tetapi juga perdagangan short, dan mempunyai mekanisme pengurusan keuntungan yang sempurna.
Prinsip Strategi
- Menggunakan indikator ATR untuk mengira amplitudo turun naik harga dan menentukan jarak hentian pengesanan berdasarkan faktor kepekaan yang ditetapkan (nilai utama)
- Mencari arah trend pasaran melalui garis rata-rata EMA, hanya membuka lebih banyak pesanan di atas garis rata-rata dan membuka kosong di bawah garis rata-rata
- Sinyal dagangan dihidupkan apabila harga menembusi garis berhenti dan mengikut arah trend
- Sistem pengurusan pegangan menggunakan kaedah keuntungan berturutan:
- Pendapatan 20% -50% dan Stop Loss akan dinaikkan kepada kos.
- Apabila keuntungan 50% - 80%, sebahagian keuntungan ditutup dan menutup kerugian
- Apabila keuntungan 80%-100% , pengetatan lebih lanjut untuk perlindungan stop loss keuntungan
- Apabila keuntungan melebihi 100 peratus, semua saham akan kosong.
Kelebihan Strategik
- Hentian pelacakan dinamik boleh mengesan trend dengan berkesan, tanpa meninggalkan permainan terlalu awal sambil melindungi keuntungan
- Penapis trend EMA berkesan mengurangkan risiko penembusan palsu
- Mekanisme keuntungan berpecah memastikan keuntungan dan memberi ruang kepada trend
- Menyokong lebih banyak perdagangan dua hala untuk memanfaatkan peluang pasaran
- Parameter yang boleh laras untuk menyesuaikan diri dengan keadaan pasaran yang berbeza
Risiko Strategik
- Perdagangan yang kerap boleh menyebabkan kerugian dalam pasaran yang bergolak
- Kemunculan semula trend mungkin menyebabkan penurunan yang lebih besar
- Tetapan parameter yang tidak betul boleh menjejaskan prestasi strategi
Cadangan kawalan risiko:
- Disyorkan untuk digunakan di pasaran yang jelas
- Parameter yang dipilih dengan berhati-hati, boleh dioptimumkan melalui pengesanan semula
- Tetapkan had pengeluaran maksimum
- Pertimbangkan untuk menambah syarat penapisan persekitaran pasaran
Arah pengoptimuman strategi
- Menambah mekanisme pengenalan keadaan pasaran, menggunakan parameter yang berbeza dalam keadaan pasaran yang berbeza
- Pengenalan penunjuk tambahan seperti jumlah trafik untuk meningkatkan kebolehpercayaan isyarat
- Mengoptimumkan mekanisme pengurusan keuntungan, menyesuaikan sasaran keuntungan mengikut kadar turun naik
- Menambah penapisan masa untuk mengelakkan dagangan pada masa yang tidak menguntungkan
- Pertimbangkan untuk memasukkan penapis kadar turun naik untuk mengurangkan kekerapan dagangan semasa turun naik berlebihan
ringkaskan
Ini adalah sistem penjejakan trend yang lengkap dan logik yang jelas. Dengan gabungan penjejakan dinamik ATR dan penapisan trend EMA, risiko dikendalikan dengan lebih baik sambil menangkap trend. Reka bentuk mekanisme keuntungan berpecah juga mencerminkan pemikiran perdagangan yang matang.
Source
Pine
/*backtest
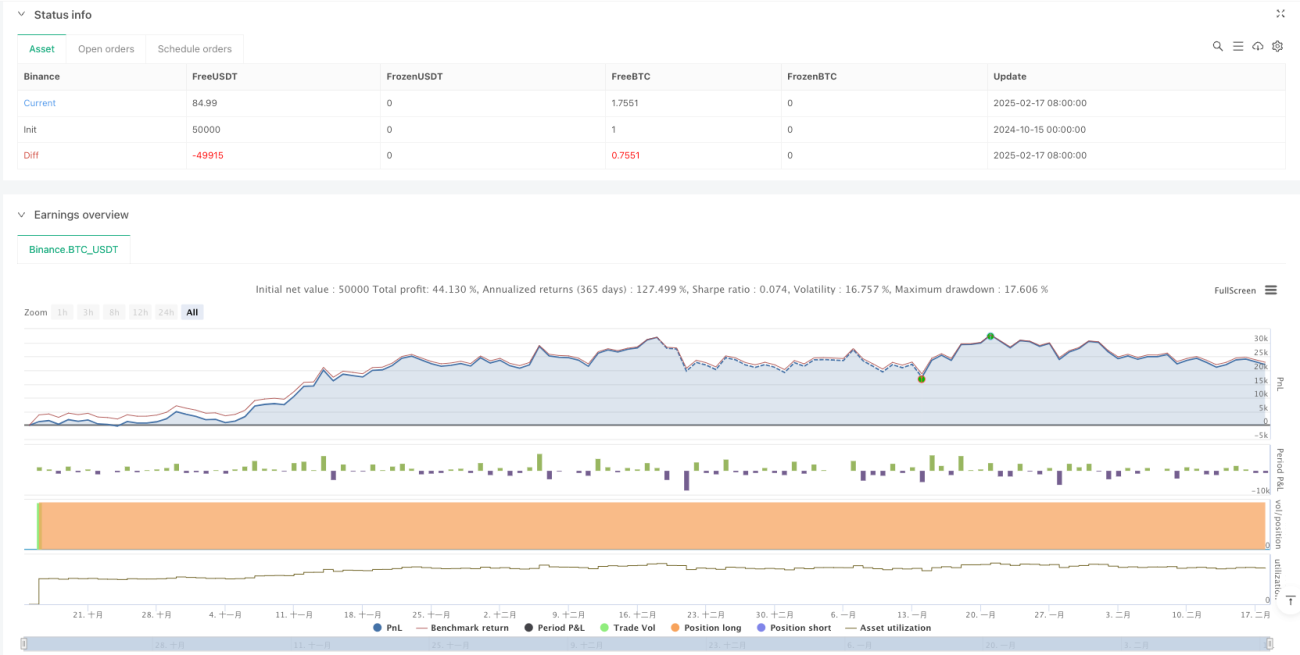
start: 2024-10-15 00:00:00
end: 2025-02-18 08:00:00
period: 1d
basePeriod: 1d
exchanges: [{"eid":"Binance","currency":"BTC_USDT"}]
*/
//@version=5
strategy("Enhanced UT Bot with Long & Short Trades", overlay=true, default_qty_type=strategy.percent_of_equity, default_qty_value=100)
// Input ParametersStrategy parameters
Related strategies
Comment
All comments (0)
No data
- 1