
Gambaran keseluruhan
Strategi ini adalah sistem perdagangan berbayangan pelbagai bingkai masa berdasarkan penunjuk rawak (Stochastic Oscillator). Ia menentukan peluang perdagangan dengan menggabungkan isyarat penunjuk rawak dari bingkai masa semasa dan bingkai masa yang lebih tinggi, dan menggunakan hentian hentian dinamik untuk menguruskan risiko.
Prinsip Strategi
Logik teras strategi adalah berdasarkan elemen utama berikut:
- Menggunakan penunjuk rawak untuk pengesahan isyarat pada dua bingkai masa (tingkat semasa dan lebih tinggi)
- Mencari tanda silang di kawasan yang terlalu banyak dibeli dan dijual
- Syarat pembelian: K pada kisaran masa semasa melalui garis D, dan K < 20; K pada kisaran masa yang lebih tinggi < 20 dan K> D
- Syarat jual: Kaki masa semasa K melalui D di bawah garis, dan K nilai> 80; lebih tinggi K nilai> 80 dan K < D
- Menggunakan sistem stop loss yang dinamik berdasarkan harga masuk, pengganda stop loss boleh disesuaikan
Kelebihan Strategik
- Pengesahan isyarat pelbagai bingkai masa meningkatkan kebolehpercayaan transaksi dan mengurangkan isyarat palsu
- Berdagang di kawasan yang terlalu banyak dibeli dan terlalu banyak dijual meningkatkan kemungkinan trend berbalik
- Sistem Stop Loss Dinamik boleh menyesuaikan secara automatik mengikut turun naik pasaran, meningkatkan fleksibiliti dalam pengurusan dana
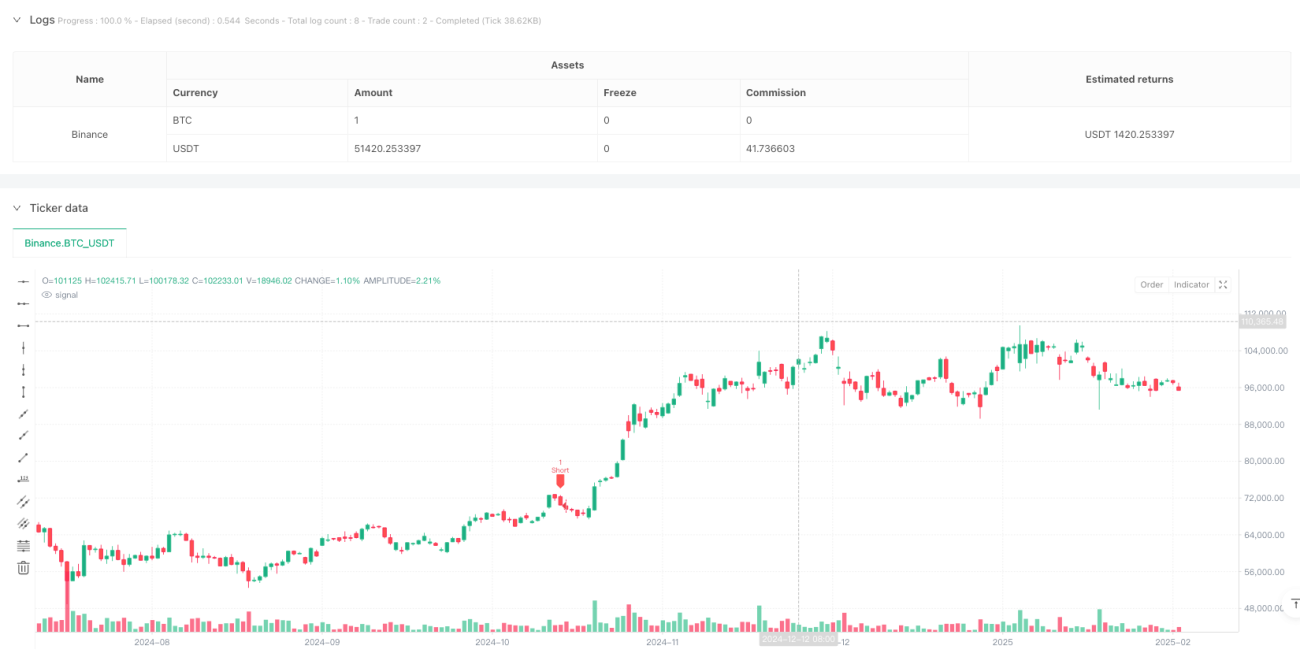
- Antara muka grafik yang menunjukkan secara intuitif isyarat perdagangan dan kedudukan stop loss untuk memudahkan pedagang memahami dan mengendalikan
- Parameter strategi boleh disesuaikan untuk menyesuaikan diri dengan keadaan pasaran yang berbeza
Risiko Strategik
- Keadaan yang mungkin sering berlaku dalam pasaran yang bergolak
- Pengesahan bingkai masa berganda boleh menyebabkan kehilangan peluang perdagangan
- Stop Loss dengan kelipatan tetap mungkin tidak sesuai untuk semua keadaan pasaran
- Mungkin terlalu awal untuk berhenti ketika trend semakin kuat
- Perlu menetapkan parameter yang munasabah untuk mengimbangi keuntungan dan risiko
Arah pengoptimuman strategi
- Memperkenalkan mekanisme hentian hentian yang beradaptasi, menyesuaikan secara dinamik mengikut turun naik pasaran
- Menambah penapis trend untuk menyesuaikan arah perdagangan dalam trend yang kuat
- Menambah petunjuk jumlah transaksi sebagai isyarat pengesahan tambahan
- Membangunkan Sistem Pengurusan Posisi yang Lebih Cerdas
- Pertimbangkan untuk memasukkan indikator sentimen pasaran untuk mengoptimumkan masa kemasukan
ringkaskan
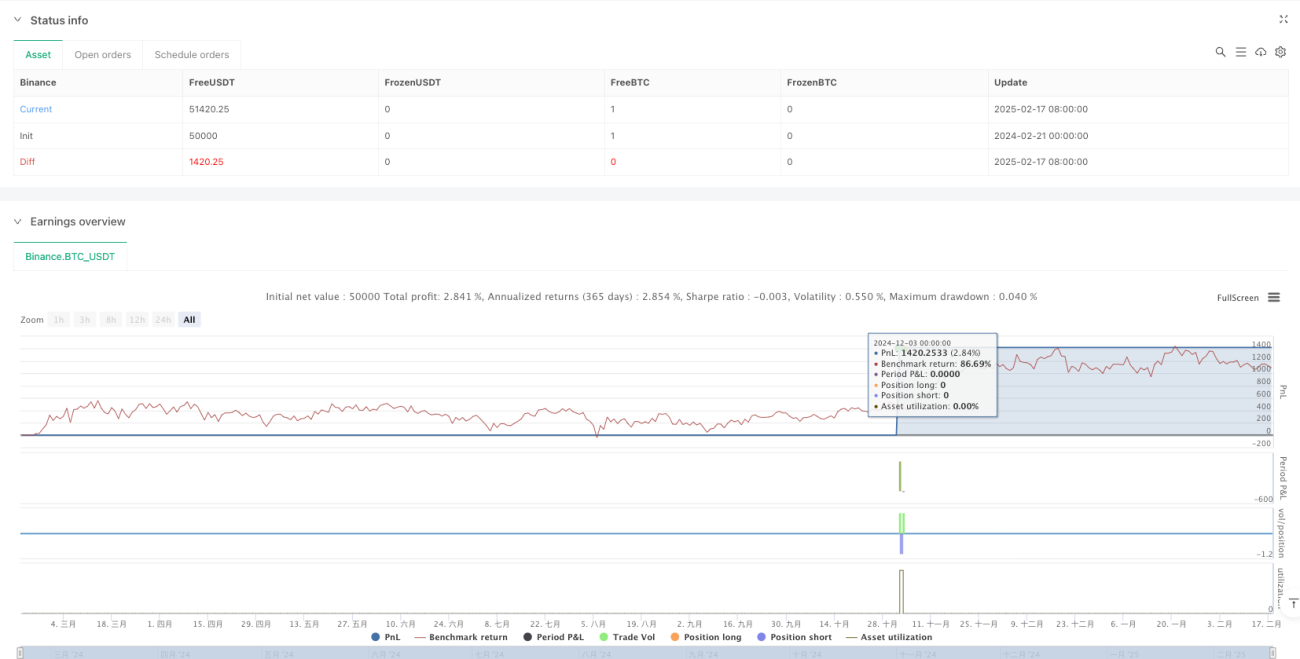
Ini adalah sistem perdagangan yang lengkap yang menggabungkan analisis teknikal dan pengurusan risiko. Dengan pengesahan isyarat dan hentian hentian dinamik dalam pelbagai jangka masa, strategi ini mempunyai potensi keuntungan yang baik sambil memastikan kestabilan. Walau bagaimanapun, pengguna perlu mengoptimumkan parameter mengikut gaya perdagangan dan persekitaran pasaran mereka sendiri, dan sentiasa mengekalkan kawalan risiko yang ketat.
- 1