Penjejakan arah aliran berbilang masa adaptif dinamik dan strategi komposit pembalikan kejutan

Gambaran keseluruhan
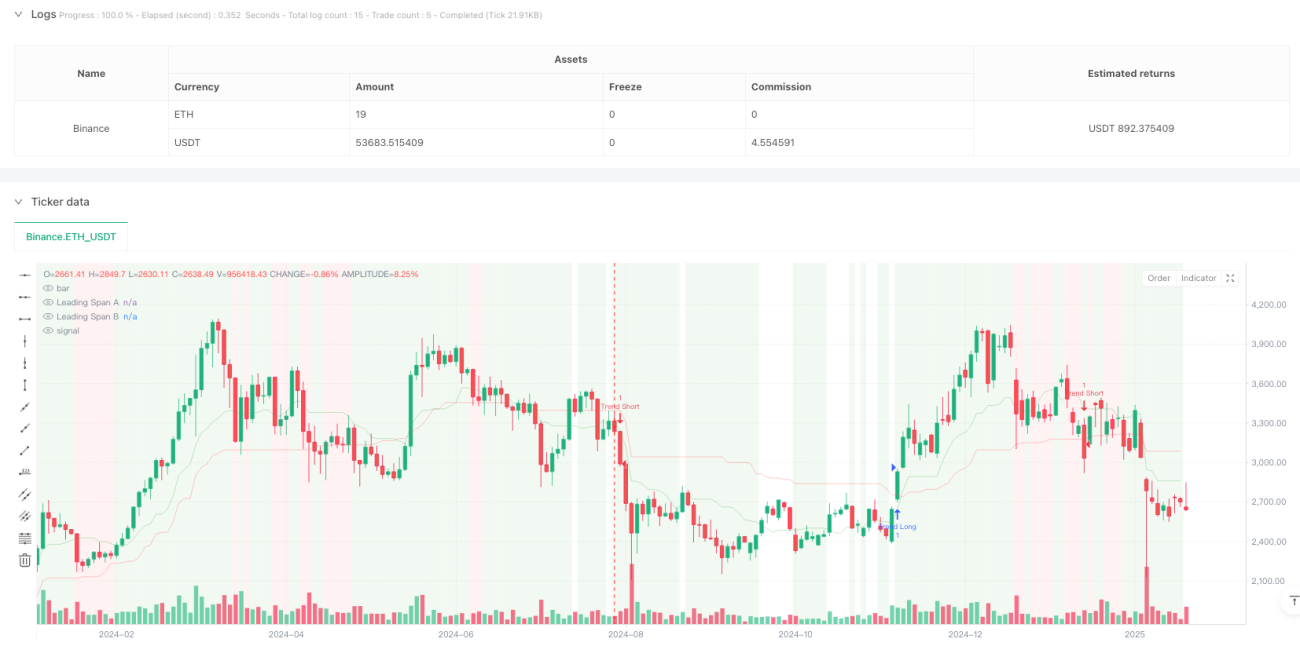
Strategi ini adalah sistem perdagangan kompleks yang menggabungkan trend tracking dan perdagangan jarak, mengenal pasti keadaan pasaran melalui grafik awan ichimoku, digabungkan dengan pengesahan dinamik MACD dan indikator RSI overbought oversold, sambil menggunakan ATR untuk pengurusan kerugian dinamik. Strategi ini mampu menangkap peluang yang berprestij di pasaran yang berprestij, mencari peluang untuk berbalik di pasaran yang bergolak, mempunyai daya serap dan fleksibiliti yang kuat.
Prinsip Strategi
Strategi ini menggunakan mekanisme pengesahan isyarat bertingkat:
- Menggunakan peta awan Ichimoku sebagai asas penghakiman utama keadaan pasaran, untuk menentukan apakah pasaran berada dalam keadaan trend atau goyah melalui hubungan kedudukan harga dengan awan
- Dalam pasaran trend, masuk lebih banyak apabila harga berada di atas awan dan RSI > 55 dan MACD adalah positif; masuk kosong apabila harga berada di bawah awan dan RSI < 45 dan MACD adalah negatif
- Di dalam pasaran yang bergolak, cari peluang melakukan plus apabila RSI <30 dan RSI <20 secara rawak; cari peluang melakukan short apabila RSI >70 dan RSI>80 secara rawak
- Menggunakan stop loss dinamik berasaskan ATR untuk menguruskan risiko dengan jarak stop loss 2 kali ganda nilai ATR
Kelebihan Strategik
- Kebolehan beradaptasi pasaran: keupayaan untuk menyesuaikan strategi perdagangan secara automatik mengikut keadaan pasaran yang berbeza, meningkatkan kestabilan strategi
- Kebolehpercayaan isyarat yang tinggi: Menggunakan mekanisme pengesahan pelbagai indikator untuk mengurangkan kesan isyarat palsu
- Pengendalian risiko yang sempurna: Dengan menghentikan kerugian dinamik melalui ATR, keuntungan dapat berkembang dengan baik dan risiko dapat dikawal dengan berkesan
- Kesan visual yang baik: keadaan pasaran ditandai dengan warna latar belakang, memudahkan pedagang memahami keadaan pasaran secara langsung
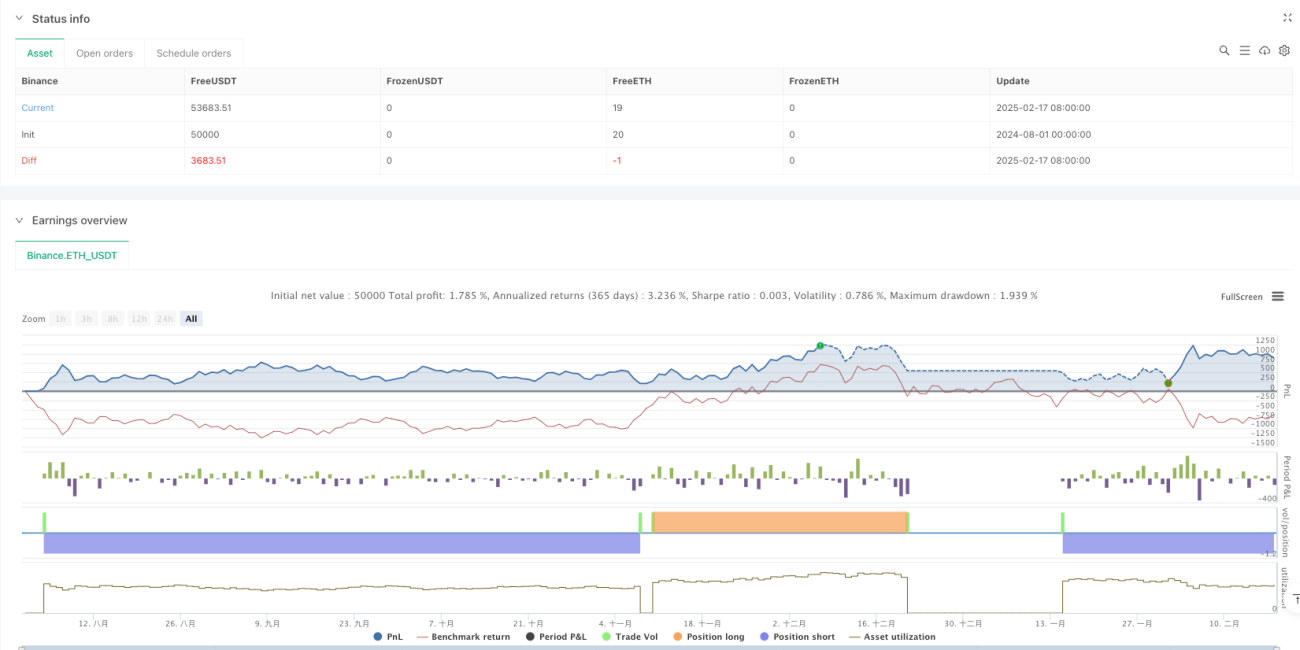
- Prestasi kitaran masa yang tinggi: Dengan faktor keuntungan 2.159 pada kitaran solar, keuntungan bersih mencapai 10.71%
Risiko Strategik
- Kemenangan rendah: Kemenangan setiap kitaran masa adalah kurang daripada 40% dan memerlukan ketahanan mental yang kuat
- Perniagaan berlebihan dengan kitaran waktu rendah: 430 transaksi dilakukan dalam kitaran 4 jam, kurang cekap
- Keterlambatan isyarat: Kemungkinan kehilangan peluang pasaran kerana menggunakan pengesahan pelbagai indikator
- Kesukaran untuk mengoptimumkan parameter: gabungan pelbagai petunjuk meningkatkan kerumitan untuk mengoptimumkan strategi
Arah pengoptimuman strategi
- Optimasi penapisan isyarat: anda boleh meningkatkan kadar kemenangan dengan menyesuaikan nilai tunjangan setiap indikator
- Penyesuaian kitaran masa: disyorkan untuk digunakan terutamanya dalam kitaran matahari dan di atas, parameter boleh disesuaikan mengikut ciri-ciri pasaran yang berbeza
- Pengoptimuman Hentikan Kerugian: boleh mempertimbangkan untuk menyesuaikan kelipatan ATR mengikut keadaan pasaran yang berbeza
- Pengoptimuman masa kemasukan: pengesahan kuantiti atau pengesahan bentuk harga boleh ditambah untuk meningkatkan ketepatan kemasukan
- Pengurusan kedudukan yang dioptimumkan: Sistem pengurusan kedudukan dinamik boleh direka berdasarkan kekuatan isyarat
ringkaskan
Strategi ini adalah sistem perdagangan komprehensif yang direka dengan logik yang jelas dan logik, dengan penggunaan gabungan pelbagai petunjuk, untuk mengenal pasti keadaan pasaran dan menangkap peluang perdagangan dengan tepat. Walaupun terdapat beberapa masalah dalam tempoh masa yang rendah, ia berfungsi dengan baik dalam tempoh masa yang lebih tinggi seperti garis matahari.
- 1