
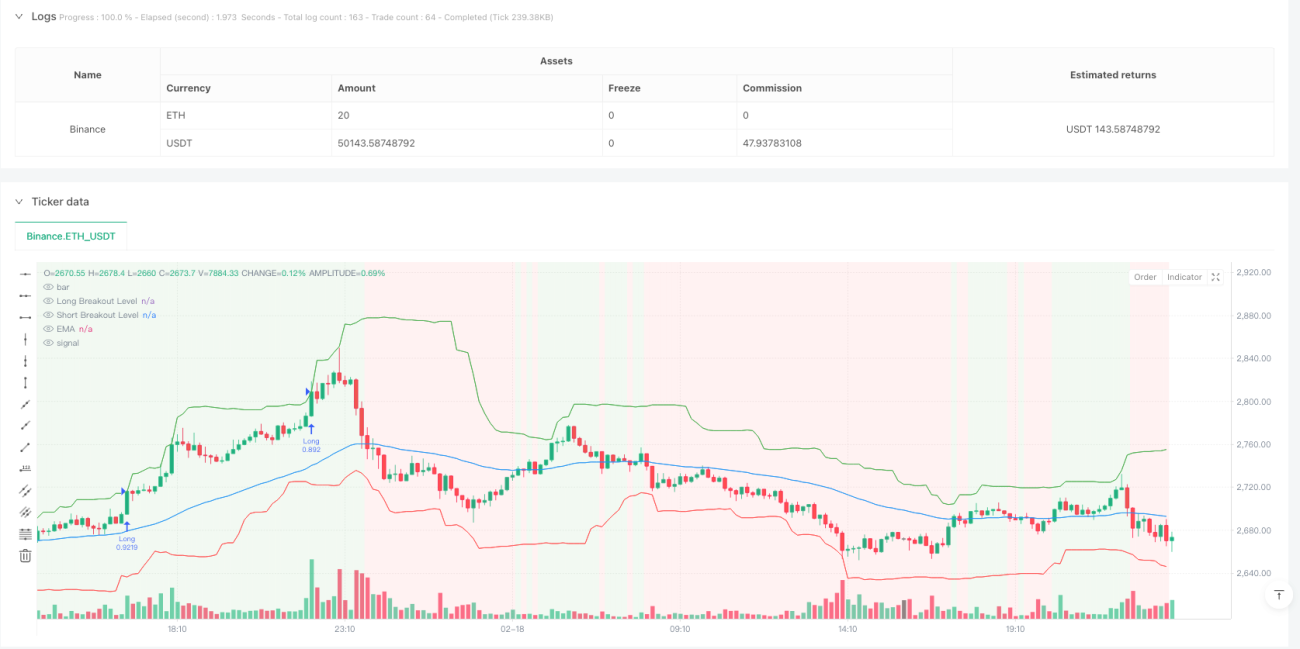
Strategi ini adalah sistem perdagangan kuantitatif yang menggabungkan volatility breakout, trend tracking dan pengesahan momentum. Ia mengenal pasti peluang perdagangan dengan mengira tahap penembusan dinamik berdasarkan ATR dan menggabungkan penapis trend EMA dan indikator momentum RSI. Strategi ini menggunakan langkah-langkah kawalan risiko yang ketat, termasuk pengurusan risiko peratusan tetap dan penyetempatan stop loss dinamik.
Strategi ini terdiri daripada tiga komponen utama:
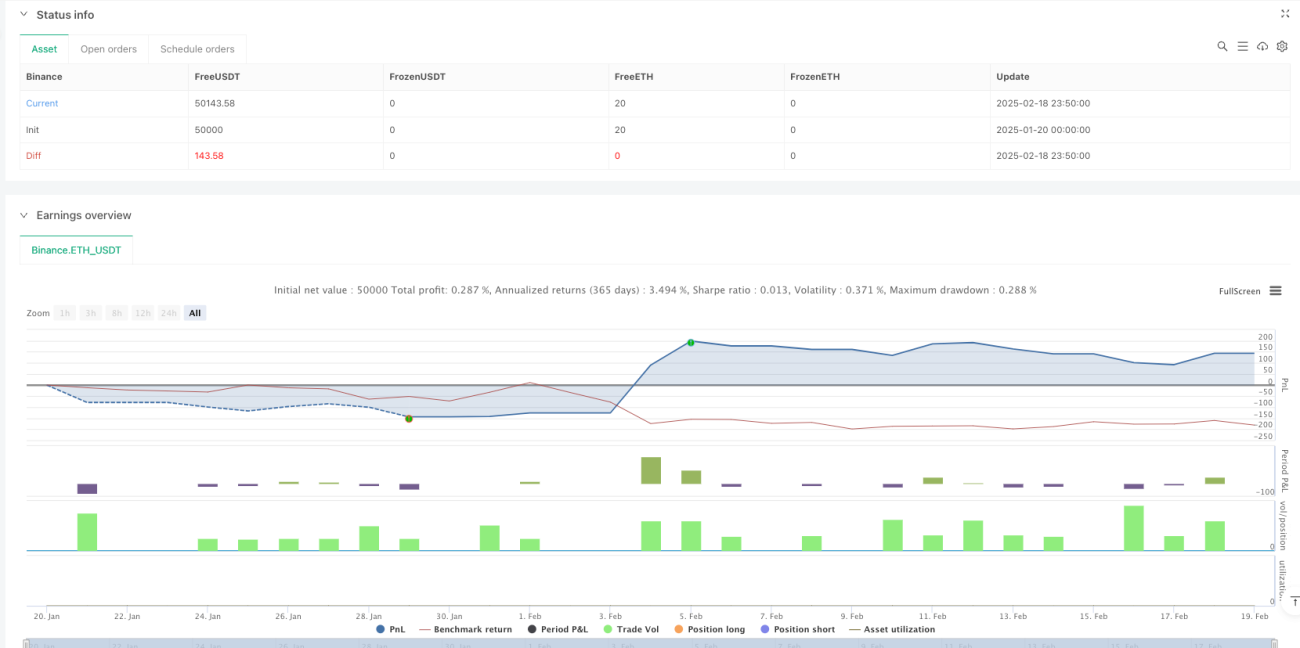
Ini adalah strategi perdagangan kuantitatif yang tersusun dengan jelas dan logik. Strategi ini menangkap turun naik harga yang ketara sambil mengawal risiko dengan menggabungkan penembusan kadar turun naik, pengesanan trend dan pengesahan dinamik. Strategi ini sangat disesuaikan dan sesuai untuk pengoptimuman lanjut untuk menyesuaikan diri dengan pelbagai jenis perdagangan dan keadaan pasaran.
/*backtest
start: 2025-01-20 00:00:00
end: 2025-02-19 00:00:00
period: 10m
basePeriod: 10m
exchanges: [{"eid":"Binance","currency":"ETH_USDT"}]
*/
//@version=5
// Volatility Momentum Breakout Strategy
//
// Description:
// This strategy is designed to capture significant price moves by combining a volatility breakout method
// with a momentum filter. Volatility is measured by the Average True Range (ATR), which is used to set dynamic
// breakout levels. A short‑term Exponential Moving Average (EMA) is applied as a trend filter, and the Relative
// Strength Index (RSI) is used to help avoid entries when the market is overextended.
//
// Signal Logic:
// • Long Entry: When the current close is above the highest high of the previous N bars (excluding the current bar)
// plus a multiple of ATR, provided that the price is above the short‑term EMA and the RSI is above 50.
// • Short Entry: When the current close is below the lowest low of the previous N bars (excluding the current bar)
// minus a multiple of ATR, provided that the price is below the short‑term EMA and the RSI is below 50.
//
// Risk Management:
// • Trades are sized to risk 2% of account equity.
// • A stop loss is placed at a fixed ATR multiple away from the entry price.
// • A take profit target is set to achieve a 1:2 risk‑reward ratio.
//
// Backtesting Parameters:
// • Initial Capital: $10,000
// • Commission: 0.1% per trade
// • Slippage: 1 tick per bar
//
// Disclaimer:
// Past performance is not indicative of future results. This strategy is experimental and provided solely for educational
// purposes. Always backtest and paper trade before any live deployment.
//
// Author: [Your Name]
// Date: [Date]
strategy("Volatility Momentum Breakout Strategy", overlay=true, initial_capital=10000, default_qty_type=strategy.percent_of_equity, default_qty_value=5, commission_type=strategy.commission.percent, commission_value=0.1, slippage=1)
// ─── INPUTS ─────────────────────────────────────────────────────────────
atrPeriod = input.int(14, "ATR Period", minval=1)
atrMultiplier = input.float(1.5, "ATR Multiplier for Breakout", step=0.1)
lookback = input.int(20, "Breakout Lookback Period", minval=1)
emaPeriod = input.int(50, "EMA Period", minval=1)
rsiPeriod = input.int(14, "RSI Period", minval=1)
rsiLongThresh = input.float(50, "RSI Long Threshold", step=0.1)
rsiShortThresh = input.float(50, "RSI Short Threshold", step=0.1)
// Risk management inputs:
riskPercent = input.float(2.0, "Risk Percent per Trade (%)", step=0.1) * 0.01 // 2% risk per trade
riskReward = input.float(2.0, "Risk-Reward Ratio", step=0.1) // Target profit is 2x risk
atrStopMult = input.float(1.0, "ATR Multiplier for Stop Loss", step=0.1) // Stop loss distance in ATRs
// ─── INDICATOR CALCULATIONS ───────────────────────────────────────────────
atrVal = ta.atr(atrPeriod)
emaVal = ta.ema(close, emaPeriod)
rsiVal = ta.rsi(close, rsiPeriod)
// Calculate breakout levels using the highest high and lowest low of the previous N bars,
// excluding the current bar (to avoid look-ahead bias).
highestHigh = ta.highest(high[1], lookback)
lowestLow = ta.lowest(low[1], lookback)
// Define breakout thresholds.
longBreakoutLevel = highestHigh + atrMultiplier * atrVal
shortBreakoutLevel = lowestLow - atrMultiplier * atrVal
// ─── SIGNAL LOGIC ─────────────────────────────────────────────────────────
// Long Entry: Price closes above the long breakout level,
// the close is above the EMA, and RSI > 50.
longCondition = (close > longBreakoutLevel) and (close > emaVal) and (rsiVal > rsiLongThresh)
// Short Entry: Price closes below the short breakout level,
// the close is below the EMA, and RSI < 50.
shortCondition = (close < shortBreakoutLevel) and (close < emaVal) and (rsiVal < rsiShortThresh)
if (longCondition)
strategy.entry("Long", strategy.long)
if (shortCondition)
strategy.entry("Short", strategy.short)
// ─── RISK MANAGEMENT ──────────────────────────────────────────────────────
// For each new trade, use the entry price as the basis for stop loss and target calculations.
// We assume the entry price equals the close on the bar where the trade is triggered.
var float longEntryPrice = na
var float shortEntryPrice = na
// Record entry prices when a trade is opened.
if (strategy.position_size > 0 and na(longEntryPrice))
longEntryPrice := strategy.position_avg_price
if (strategy.position_size < 0 and na(shortEntryPrice))
shortEntryPrice := strategy.position_avg_price
// Calculate stop loss and take profit levels based on ATR.
longStop = longEntryPrice - atrStopMult * atrVal
longTarget = longEntryPrice + (longEntryPrice - longStop) * riskReward
shortStop = shortEntryPrice + atrStopMult * atrVal
shortTarget= shortEntryPrice - (shortStop - shortEntryPrice) * riskReward
// Issue exit orders if a position is open.
if (strategy.position_size > 0 and not na(longEntryPrice))
strategy.exit("Long Exit", from_entry="Long", stop=longStop, limit=longTarget)
if (strategy.position_size < 0 and not na(shortEntryPrice))
strategy.exit("Short Exit", from_entry="Short", stop=shortStop, limit=shortTarget)
// Reset recorded entry prices when the position is closed.
if (strategy.position_size == 0)
longEntryPrice := na
shortEntryPrice := na
// ─── CHART VISUAL AIDS ─────────────────────────────────────────────────────
// Plot the breakout levels and EMA.
plot(longBreakoutLevel, color=color.new(color.green, 0), title="Long Breakout Level", style=plot.style_linebr)
plot(shortBreakoutLevel, color=color.new(color.red, 0), title="Short Breakout Level", style=plot.style_linebr)
plot(emaVal, color=color.blue, title="EMA")
// Optionally, shade the background: green when price is above the EMA (bullish) and red when below.
bgcolor(close > emaVal ? color.new(color.green, 90) : color.new(color.red, 90), title="Trend Background")