Strategi Kawalan Risiko Dinamik Corak Engulfing Supertrend

Gambaran keseluruhan
Ini adalah strategi perdagangan lanjutan yang menggabungkan indikator Supertrend dan corak pengapungan. Strategi ini mengesan corak corak pengapungan dalam pasaran, dan memastikan arah trend dengan indikator Supertrend, untuk memfilterkan isyarat perdagangan yang tepat. Strategi ini juga mengintegrasikan pengaturan berhenti dan keuntungan yang dinamik, mengawal risiko dengan berkesan sambil memastikan ruang keuntungan.
Prinsip Strategi
Strategi ini berdasarkan kepada prinsip-prinsip utama berikut:
- Menggunakan ATR (Average True Rate) untuk mengira indikator Supertrend untuk menentukan trend pasaran keseluruhan.
- Penyaringan bentuk penyerapan yang berkesan dilakukan dengan menetapkan Boring Candle Threshold dan Engulfing Candle Threshold.
- Hanya masukkan kedudukan apabila arah trend Supertrend selaras dengan arah bentuk menelan.
- Menggunakan kedudukan berhenti dan keuntungan yang dinamik, berdasarkan harga pembukaan kedudukan yang dikira mengikut perkadaran.
- Menggunakan strategi pengurusan kedudukan untuk memastikan hanya satu arah dagangan pada masa yang sama.
Kelebihan Strategik
- Kawalan kualiti isyarat ketat, meningkatkan ketepatan dengan pengesahan dua kali ((kecenderungan + bentuk).
- Menerangkan konsep boring and swallowing thresholds untuk menyaring isyarat palsu.
- Perhitungan Supertrend dinamik berdasarkan ATR menjadikan strategi ini mempunyai kebolehan beradaptasi dengan pasaran.
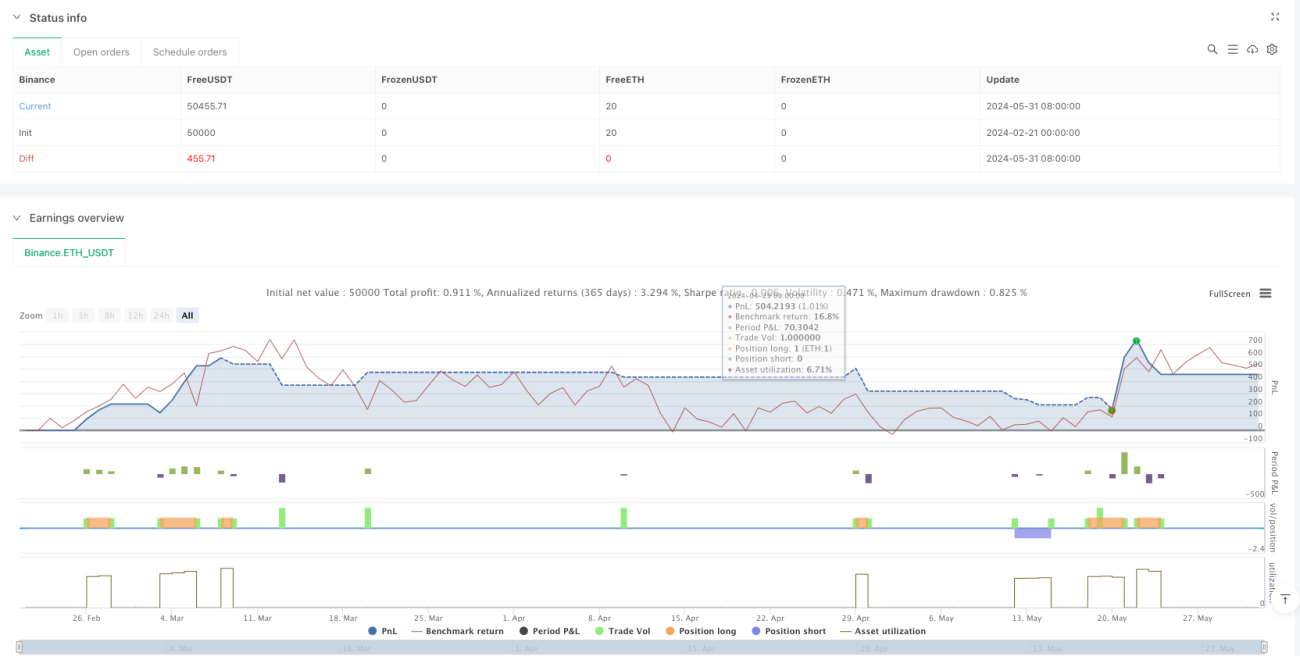
- Mekanisme pengurusan kerugian dan keuntungan yang baik, mengawal risiko dan mengunci keuntungan.
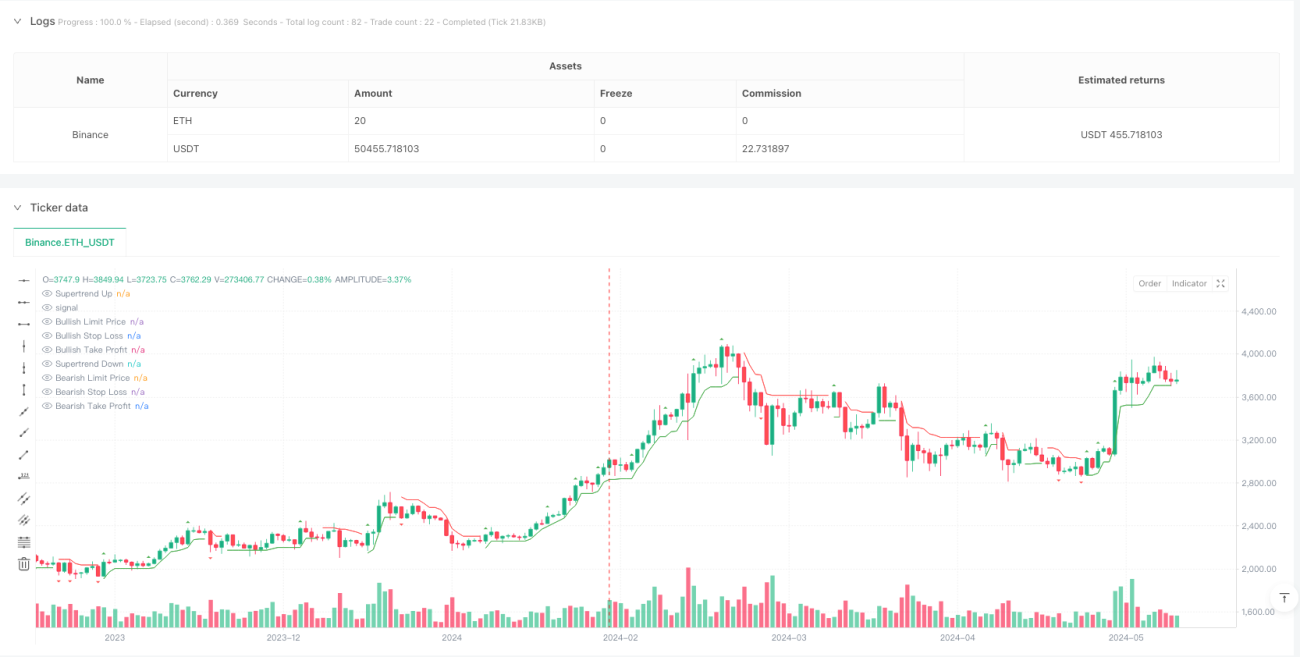
- Visual yang sempurna, isyarat dagangan, titik henti rugi dan sasaran keuntungan jelas.
Risiko Strategik
- Dalam pasaran yang bergolak, isyarat palsu yang sering berlaku boleh menyebabkan penembusan.
- Tetapan pegangan kerugian dan keuntungan yang tetap mungkin tidak sesuai untuk semua keadaan pasaran.
- Ia mungkin akan menjadi lebih besar apabila trend berbalik.
- Parameter yang sensitif kepada tetapan parameter, parameter yang tidak betul boleh menyebabkan persembahan strategi yang buruk.
- Dalam pasaran yang kurang cair, risiko tergelincir mungkin berlaku.
Arah pengoptimuman strategi
- Indeks kuantiti boleh diperkenalkan sebagai pengesahan isyarat.
- Pertimbangkan untuk menyertakan mekanisme ATR yang dinamik.
- Perkadaran stop loss dan profit disesuaikan secara dinamik berdasarkan turun naik kadar pasaran.
- Menambah penapis masa untuk mengelakkan dagangan pada masa yang tidak sesuai.
- Pertimbangkan untuk menambah penapis intensiti trend untuk meningkatkan kualiti transaksi.
ringkaskan
Ini adalah strategi yang direka dengan ketat, logik yang jelas, dengan menggabungkan petunjuk teknikal dan analisis bentuk, kawalan kualiti isyarat yang lebih baik dapat dicapai. Kaedah ini mempunyai mekanisme pengurusan risiko yang sempurna, kesan visualisasi yang sangat baik, sesuai untuk ujian dan pengoptimuman di lapangan.
- 1