
Strategi ini adalah sistem pengesanan trend yang menggabungkan beberapa petunjuk teknikal. Ia adalah berdasarkan pada isyarat silang RSI, MACD dan SMA untuk menentukan arah perdagangan, sambil menggunakan ATR untuk secara dinamik menyesuaikan tahap stop loss dan keuntungan. Strategi ini juga menggabungkan penapis jumlah perdagangan untuk memastikan perdagangan dilakukan di bawah kebocoran pasaran yang mencukupi, dan menggunakan beberapa mekanisme penangguhan untuk mengoptimumkan pengurusan wang.
Strategi ini menggunakan mekanisme triple verification untuk mengesahkan isyarat transaksi:
Tujuan pengesahan berganda adalah untuk mengurangkan isyarat palsu dan meningkatkan ketepatan perdagangan. Strategi ini dibuat apabila beberapa syarat dipenuhi (trend up + RSI melalui 40 + MACD up + pengesahan jumlah transaksi) untuk membuka kedudukan dan menggunakan ATR dua kali ganda sebagai stop loss dan empat kali ganda sebagai stop loss.
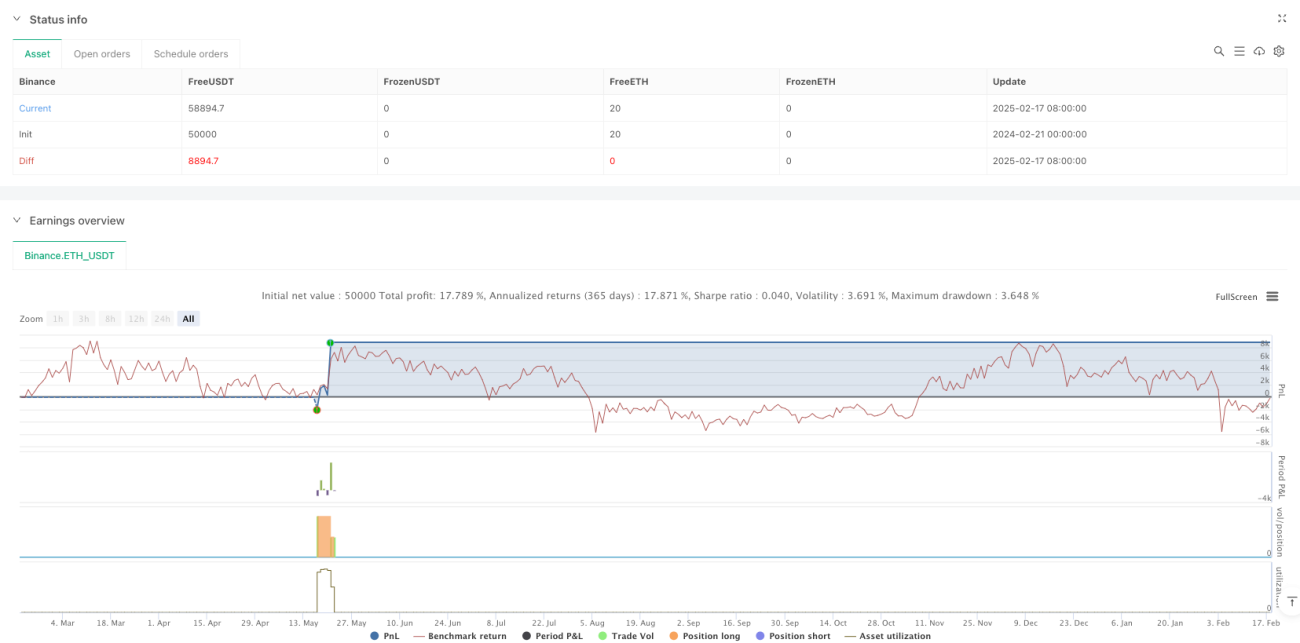
Ini adalah strategi trend pengesanan yang komprehensif, dengan penggunaan gabungan pelbagai petunjuk teknikal, membina sistem perdagangan yang mantap. Ciri utama strategi ini adalah untuk menyesuaikan diri dengan perubahan pasaran melalui mekanisme berhenti dan keuntungan yang dinamik, sambil memastikan keselamatan. Walaupun terdapat beberapa tempat yang perlu dioptimumkan, kerangka keseluruhan adalah munasabah dan sesuai untuk penyempurnaan lanjut dan ujian lapangan.
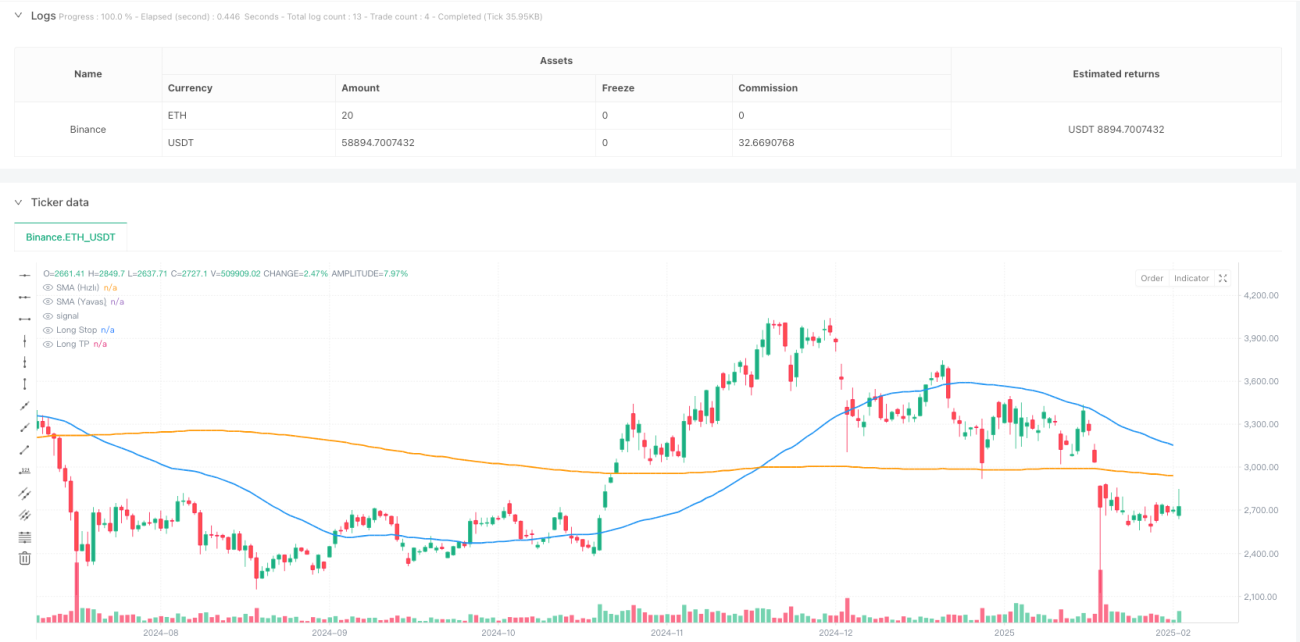
/*backtest
start: 2024-02-21 00:00:00
end: 2025-02-18 08:00:00
period: 1d
basePeriod: 1d
exchanges: [{"eid":"Binance","currency":"ETH_USDT"}]
*/
//@version=5
strategy( title="AI Trade Strategy v2 (Extended) - Fixed", shorttitle="AI_Trade_v2", overlay=true, format=format.price, initial_capital=100000, default_qty_type=strategy.percent_of_equity, default_qty_value=100, pyramiding=0)
//============================================================================
//=== 1) Basic Indicators (SMA, RSI, MACD) ==================================
//============================================================================
// Time Filter (optional, you can update)
inDateRange = (time >= timestamp("2018-01-01T00:00:00")) and (time <= timestamp("2069-01-01T00:00:00"))
// RSI Parameters
rsiLength = input.int(14, "RSI Period")
rsiOB = input.int(60, "RSI Overbought Level")
rsiOS = input.int(40, "RSI Oversold Level")
rsiSignal = ta.rsi(close, rsiLength)
// SMA Parameters
smaFastLen = input.int(50, "SMA Fast Period")
smaSlowLen = input.int(200, "SMA Slow Period")
smaFast = ta.sma(close, smaFastLen)
smaSlow = ta.sma(close, smaSlowLen)
// MACD Parameters
fastLength = input.int(12, "MACD Fast Period")
slowLength = input.int(26, "MACD Slow Period")
signalLength = input.int(9, "MACD Signal Period")
[macdLine, signalLine, histLine] = ta.macd(close, fastLength, slowLength, signalLength)
//============================================================================
//=== 2) Additional Filter (Volume) ========================================
//============================================================================
useVolumeFilter = input.bool(true, "Use Volume Filter?")
volumeMaPeriod = input.int(20, "Volume MA Period")
volumeMa = ta.sma(volume, volumeMaPeriod)
// If volume filter is enabled, current bar volume should be greater than x times the average volume
volMultiplier = input.float(1.0, "Volume Multiplier (Volume > x * MA)")
volumeFilter = not useVolumeFilter or (volume > volumeMa * volMultiplier)
//============================================================================
//=== 3) Trend Conditions (SMA) ============================================
//============================================================================
isBullTrend = smaFast > smaSlow
isBearTrend = smaFast < smaSlow
//============================================================================
//=== 4) Entry Conditions (RSI + MACD + Trend + Volume) ====================
//============================================================================
// RSI crossing above 30 + Bullish Trend + Positive MACD + Volume Filter
longCondition = isBullTrend and ta.crossover(rsiSignal, rsiOS) and (macdLine > signalLine) and volumeFilter
shortCondition = isBearTrend and ta.crossunder(rsiSignal, rsiOB) and (macdLine < signalLine) and volumeFilter
//============================================================================
//=== 5) ATR-based Stop + Trailing Stop ===================================
//============================================================================
atrPeriod = input.int(14, "ATR Period")
atrMultiplierSL = input.float(2.0, "Stop Loss ATR Multiplier")
atrMultiplierTP = input.float(4.0, "Take Profit ATR Multiplier")
atrValue = ta.atr(atrPeriod)
//============================================================================
//=== 6) Trade (Position) Management ======================================
//============================================================================
if inDateRange
//--- Long Entry ---
if longCondition
strategy.entry(id="Long", direction=strategy.long, comment="Long Entry")
//--- Short Entry ---
if shortCondition
strategy.entry(id="Short", direction=strategy.short, comment="Short Entry")
//--- Stop & TP for Long Position ---
if strategy.position_size > 0
// ATR-based fixed Stop & TP calculation
longStopPrice = strategy.position_avg_price - atrValue * atrMultiplierSL
longTakeProfit = strategy.position_avg_price + atrValue * atrMultiplierTP
// PARTIAL EXIT: (Example) take 50% of the position at early TP
partialTP = strategy.position_avg_price + (atrValue * 2.5)
strategy.exit( id = "Partial TP Long", stop = na, limit = partialTP, qty_percent= 50, from_entry = "Long" )
// Trailing Stop + Final ATR Stop
// WARNING: trail_offset=... is the offset in price units.
// For example, in BTCUSDT, a value like 300 means a 300 USDT trailing distance.
float trailingDist = atrValue * 1.5
strategy.exit( id = "Long Exit (Trail)", stop = longStopPrice, limit = longTakeProfit, from_entry = "Long", trail_offset= trailingDist )
//--- Stop & TP for Short Position ---
if strategy.position_size < 0
// ATR-based fixed Stop & TP calculation for Short
shortStopPrice = strategy.position_avg_price + atrValue * atrMultiplierSL
shortTakeProfit = strategy.position_avg_price - atrValue * atrMultiplierTP
// PARTIAL EXIT: (Example) take 50% of the position at early TP
partialTPShort = strategy.position_avg_price - (atrValue * 2.5)
strategy.exit( id = "Partial TP Short", stop = na, limit = partialTPShort, qty_percent= 50, from_entry = "Short" )
// Trailing Stop + Final ATR Stop for Short
float trailingDistShort = atrValue * 1.5
strategy.exit( id = "Short Exit (Trail)", stop = shortStopPrice, limit = shortTakeProfit, from_entry = "Short", trail_offset= trailingDistShort )
//============================================================================
//=== 7) Plot on Chart (SMA, etc.) =========================================
//============================================================================
plot(smaFast, color=color.blue, linewidth=2, title="SMA (Fast)")
plot(smaSlow, color=color.orange, linewidth=2, title="SMA (Slow)")
// (Optional) Plot Stop & TP levels dynamically:
longStopForPlot = strategy.position_size > 0 ? strategy.position_avg_price - atrValue * atrMultiplierSL : na
longTPForPlot = strategy.position_size > 0 ? strategy.position_avg_price + atrValue * atrMultiplierTP : na
shortStopForPlot = strategy.position_size < 0 ? strategy.position_avg_price + atrValue * atrMultiplierSL : na
shortTPForPlot = strategy.position_size < 0 ? strategy.position_avg_price - atrValue * atrMultiplierTP : na
plot(longStopForPlot, color=color.red, style=plot.style_linebr, title="Long Stop")
plot(longTPForPlot, color=color.green, style=plot.style_linebr, title="Long TP")
plot(shortStopForPlot, color=color.red, style=plot.style_linebr, title="Short Stop")
plot(shortTPForPlot, color=color.green, style=plot.style_linebr, title="Short TP")