Strategi penjejakan aliran silang berbilang penunjuk digabungkan dengan anjakan semula Fibonacci dan sistem pengoptimuman henti untung dan henti rugi

Gambaran keseluruhan
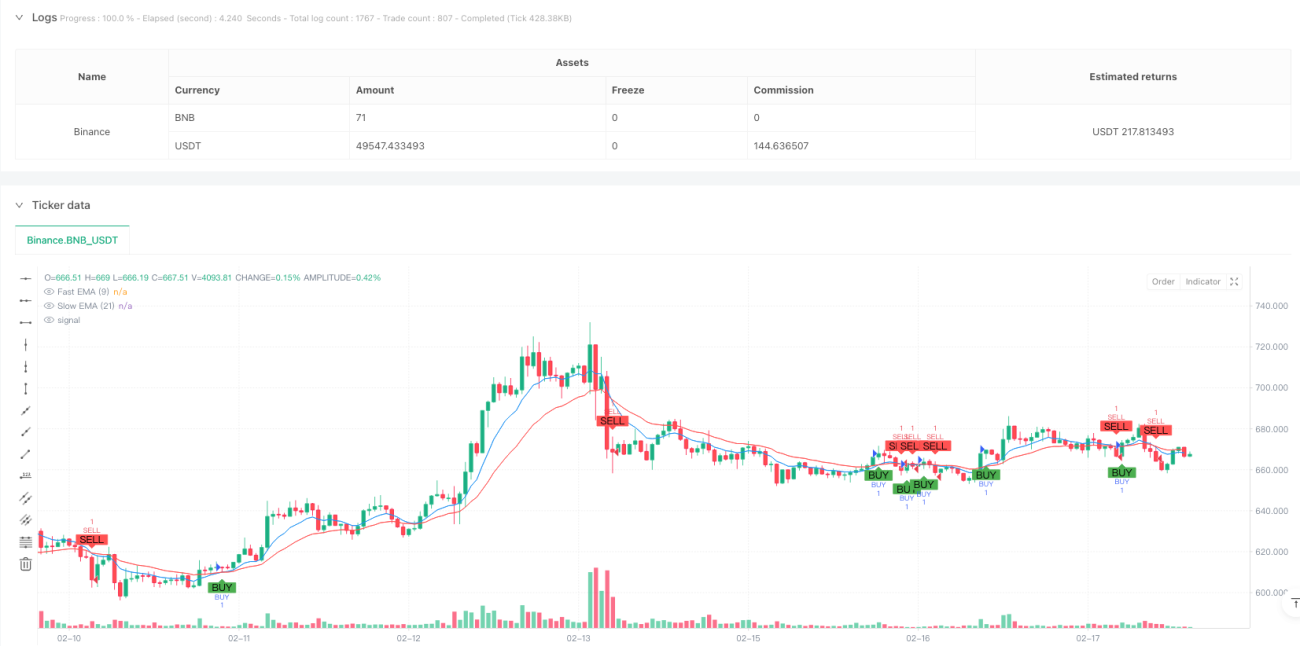
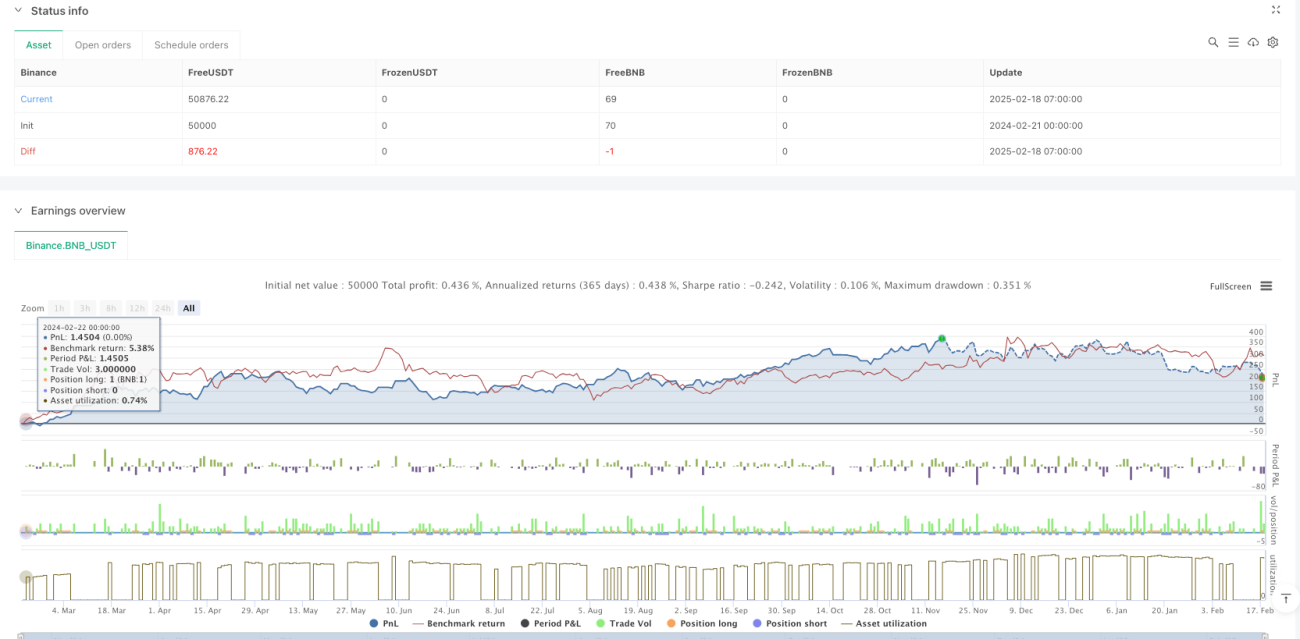
Strategi ini adalah sistem perdagangan komprehensif yang menggabungkan crossover rata-rata bergerak indeks (EMA), tahap regresi Fibonacci, penilaian trend, dan mekanisme hentian hentian. Strategi ini menentukan isyarat perdagangan melalui crossover 9 kitaran dan 21 kitaran EMA, sambil menggabungkan tahap regresi Fibonacci untuk mengoptimumkan tempat masuk, dan meningkatkan ketepatan perdagangan melalui pemantauan status trend dalam masa nyata. Sistem ini juga mengintegrasikan mekanisme hentian hentian peratusan, mengawal risiko dengan berkesan.
Prinsip Strategi
Logik teras strategi adalah berdasarkan elemen utama berikut:
- Apabila EMA cepat ((9 kitaran) melintasi EMA perlahan ((21 kitaran) ke atas, sistem menghasilkan isyarat ganda
- Apabila EMA pantas melintasi EMA perlahan ke bawah, sistem menghasilkan isyarat kosong
- Dengan mengira harga tertinggi dan terendah dalam 100 kitaran, tahap Fibonacci retracement 23.6%, 38.2%, 50% dan 61.8% digambarkan
- Keadaan trend semasa dinilai melalui hubungan antara harga penutupan dan kedudukan EMA pantas
- Apabila perdagangan dijalankan, sistem secara automatik menetapkan peratusan yang tetap untuk stop loss ((4%) dan stop loss ((2%)
Kelebihan Strategik
- Pengesahan isyarat multidimensi: menggabungkan EMA crossover, tahap Fibonacci dan keadaan trend untuk memberikan isyarat dagangan yang lebih dipercayai
- Pengurusan risiko yang sempurna: Kawalan risiko automatik dengan peratusan Stop Loss yang ditetapkan
- Keupayaan untuk menjejaki trend: EMA menyeberang untuk menilai keadaan trend, untuk menangkap trend pasaran dengan berkesan
- Maklum balas visual yang jelas: menunjukkan tahap harga utama, status trend dan isyarat perdagangan dengan label untuk memudahkan keputusan perdagangan
- Tingkat sistematisasi yang tinggi: logik transaksi jelas, mengurangkan gangguan penilaian subjektif
Risiko Strategik
- Risiko pasaran bergoyang: EMA yang kerap bercampur boleh menyebabkan isyarat palsu pada peringkat penyusunan horizontal
- Risiko ketinggalan: Purata bergerak pada dasarnya adalah penunjuk ketinggalan, mungkin terlepas peluang masuk yang terbaik
- Risiko Stop Loss Tetap: Stop loss peratusan tetap mungkin tidak sesuai untuk semua keadaan pasaran
- Risiko pertentangan isyarat: mungkin terdapat pertentangan isyarat antara pelbagai petunjuk, meningkatkan kesukaran membuat keputusan
- Risiko turun naik pasaran: turun naik yang kuat boleh menyebabkan titik berhenti yang tidak munasabah
Arah pengoptimuman strategi
- Optimasi hentian dinamik: jarak hentian boleh disesuaikan secara dinamik mengikut ATR atau kadar turun naik pasaran
- Penguatan penapisan isyarat: meningkatkan jumlah lalu lintas, kuasa dan lain-lain untuk menapis isyarat palsu
- Parameter penyesuaian diri: memperkenalkan mekanisme penyesuaian diri, menyesuaikan kitaran EMA mengikut keadaan pasaran yang dinamik
- Pengoptimuman kemasukan: pengoptimuman kemasukan berhampiran tahap Fibonacci dengan menggabungkan bentuk harga dan jumlah urus niaga
- Pengurusan kedudukan yang sempurna: Sistem pengurusan kedudukan dinamik yang direka berdasarkan kadar turun naik dan risiko akaun
ringkaskan
Strategi ini membina sistem perdagangan yang lebih lengkap dengan mengintegrasikan beberapa alat analisis teknikal klasik. Kelebihannya adalah kepelbagaian pengesahan isyarat dan pengaturcaraan pengurusan risiko, tetapi masih memerlukan pengoptimuman untuk keadaan pasaran yang berbeza.
- 1