
Gambaran keseluruhan
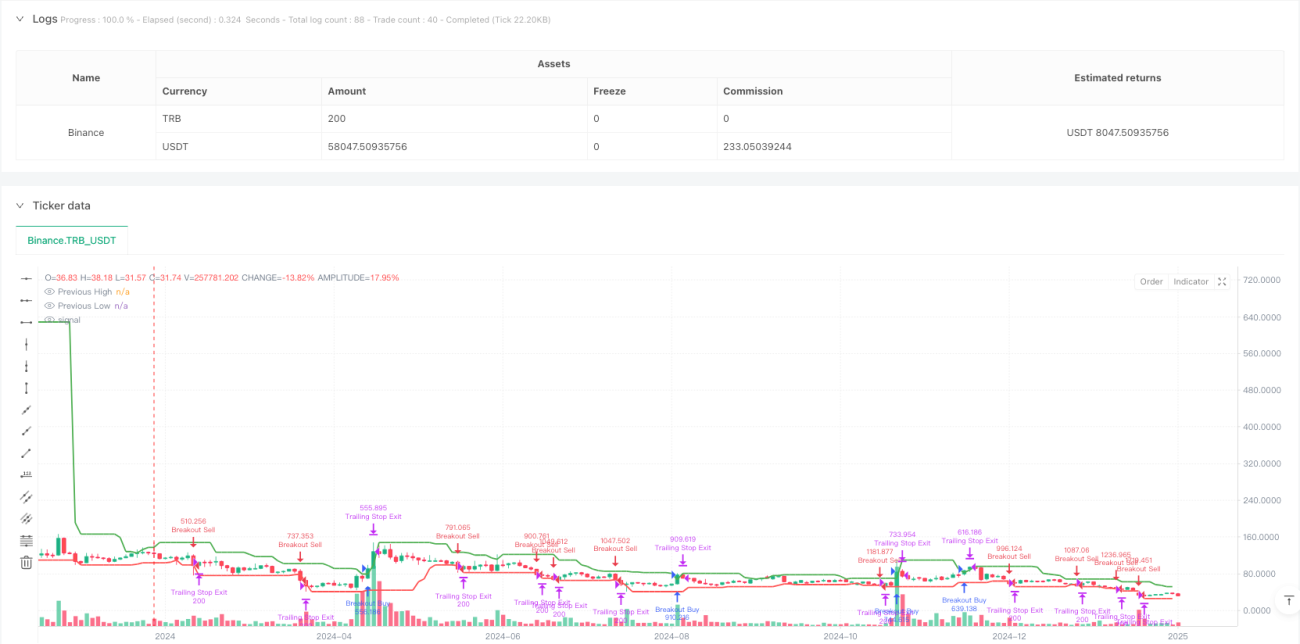
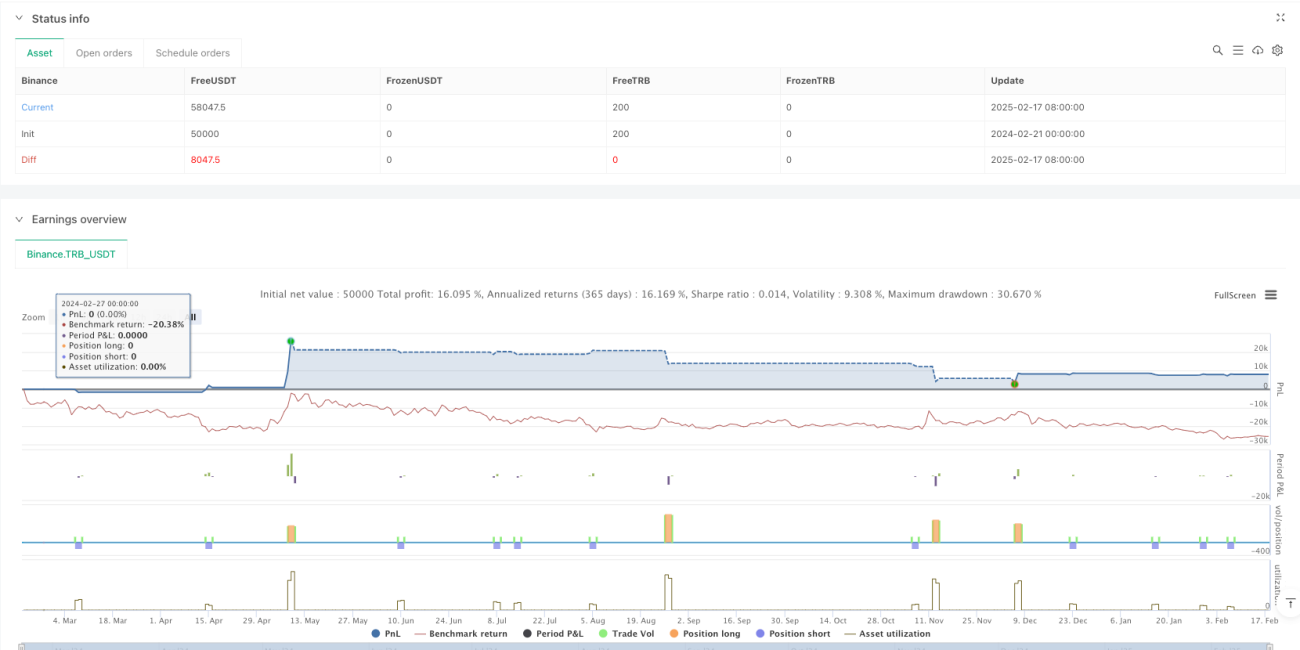
Strategi ini adalah sistem perdagangan yang berdasarkan kepada penembusan harga dan pengesanan hentian secara dinamik. Ia melakukan perdagangan dengan memantau harga tertinggi dan terendah dalam tempoh N kitaran lalu, apabila harga menembusi tahap-tahap penting ini. Strategi ini menggunakan mekanisme hentian pintar, yang mengaktifkan hentian pengesanan hanya setelah mencapai keuntungan 1%, yang membolehkan keuntungan berkembang sepenuhnya.
Prinsip Strategi
Logik teras strategi merangkumi bahagian penting berikut:
- Isyarat masuk: Dengan mengira harga tertinggi dan terendah dalam tempoh N kitaran lalu, isyarat perdagangan dicetuskan apabila harga semasa menembusi tahap ini. Masuk dengan banyak kepala memerlukan peratusan tertentu harga untuk menembusi tahap tertinggi sebelum ini, dan kepala kosong memerlukan penembusan tahap rendah sebelum ini.
- Pengurusan dagangan: melaksanakan tempoh sejuk 1 jam untuk mengelakkan dagangan yang kerap semasa turun naik yang teruk.
- Kawalan risiko: Menggunakan hentian pelacakan dinamik, yang diaktifkan hanya selepas keuntungan 1%, dapat melindungi keuntungan dengan lebih baik.
- Optimasi parameter: parameter utama seperti kitaran semak semula, penembusan had, peratusan hentian dan sebagainya boleh disesuaikan dengan keadaan pasaran yang berbeza.
Kelebihan Strategik
- Pengurusan risiko dinamik: Dengan mengesan mekanisme berhenti kerugian, strategi dapat meningkatkan keuntungan secara berterusan sambil melindungi keuntungan.
- Keupayaan untuk menyesuaikan diri: Strategi boleh menyesuaikan diri dengan keadaan pasaran yang berbeza, untuk mengoptimumkan prestasi dengan menyesuaikan parameter.
- Mekanisme penapisan: Menggunakan tempoh penyejukan perdagangan untuk mengelakkan perdagangan berlebihan dan meningkatkan kualiti transaksi.
- Sederhana dan berkesan: logik strategi jelas, mudah difahami dan dilaksanakan, sambil mengekalkan skalabilitas yang baik.
Risiko Strategik
- Risiko penembusan palsu: Pasaran mungkin mengalami penembusan palsu yang menyebabkan isyarat yang salah. Disarankan untuk meningkatkan pengesahan jumlah transaksi.
- Kesan slippage: Dalam tempoh turun naik yang tinggi, mungkin terdapat slippage yang lebih besar yang mempengaruhi prestasi strategi.
- Sensitiviti parameter: Prestasi strategi lebih sensitif kepada tetapan parameter dan memerlukan pengoptimuman yang berhati-hati.
- Kepercayaan kepada keadaan pasaran: mungkin kurang baik dalam keadaan turun naik yang rendah.
Arah pengoptimuman strategi
- Memperkenalkan penunjuk jumlah transaksi: meningkatkan kebolehpercayaan isyarat terobosan melalui pengesahan jumlah transaksi.
- Menambah penapis trend: Berdagang hanya dalam arah trend, digabungkan dengan indikator trend jangka panjang.
- Penyesuaian parameter dinamik: penyesuaian parameter penembusan dan penangguhan secara automatik mengikut turun naik pasaran.
- Multiple time period: menggabungkan isyarat dari pelbagai tempoh masa untuk meningkatkan ketepatan.
ringkaskan
Ini adalah strategi penjejakan trend yang direka dengan munasabah, yang digabungkan dengan penembusan harga dan hentian dinamik, yang dapat menangkap trend besar dan dapat mengawal risiko dengan berkesan. Strategi ini sangat disesuaikan, dan dapat disesuaikan dengan keadaan pasaran yang berbeza melalui pengoptimuman parameter.
- 1