Strategi regresi silang RSI berbilang peringkat

Gambaran keseluruhan
Strategi ini adalah sistem perdagangan automatik berdasarkan indikator yang agak kuat (RSI) yang digunakan untuk menangkap peluang rebound yang berpotensi, terutamanya dengan mengenal pasti keadaan pasaran yang terlalu banyak dijual. Strategi ini menggunakan kaedah pembinaan kedudukan beransur-ansur, membina beberapa kedudukan secara beransur-ansur apabila RSI melintasi tahap rendah, dan mengawal risiko dengan menetapkan sasaran keuntungan.
Prinsip Strategi
Logik teras strategi adalah berdasarkan elemen utama berikut:
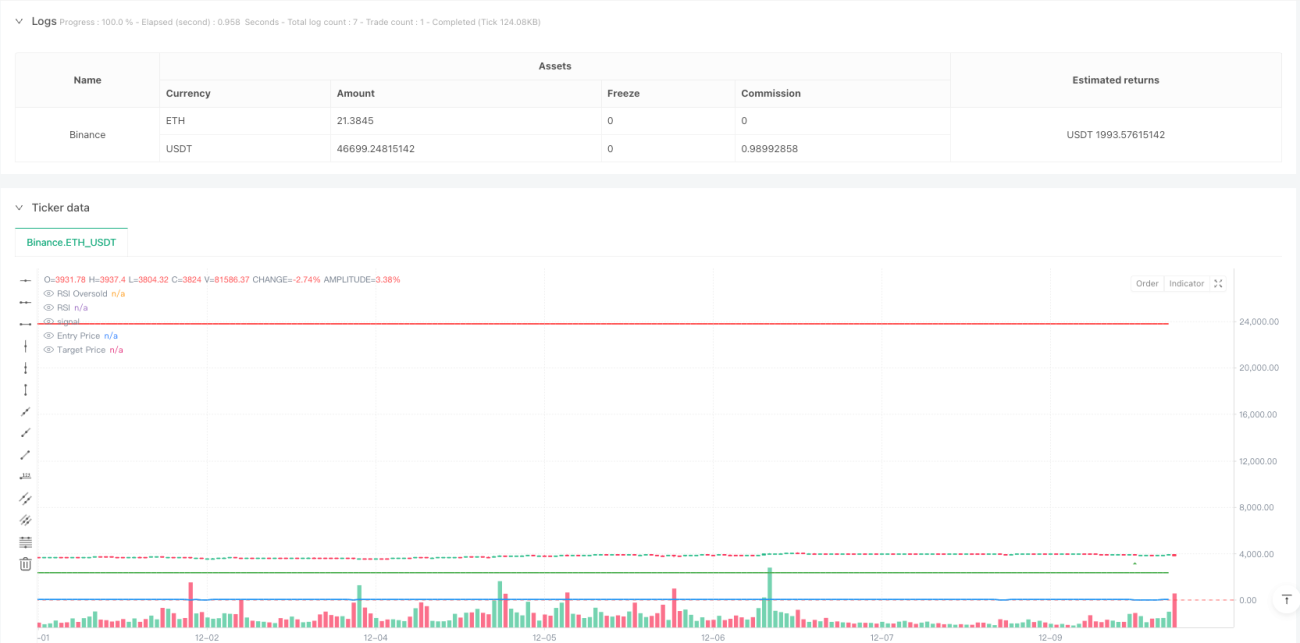
- Isyarat masuk: mencetuskan isyarat beli apabila RSI 14 kitaran menembusi tahap jual beli 28.5
- Pentadbiran Kedudukan: 6.6% daripada hak milik akaun penggunaan setiap kali membina gudang, sehingga 15 kali berturut-turut dibenarkan
- Keuntungan: 50% dari pegangan apabila harga mencapai kenaikan 900% dari harga purata untuk penempatan
- Paparan visual: tanda pada carta untuk isyarat beli dan jual, garis RSI, harga masuk dan harga sasaran
Strategi untuk menilai pergerakan pasaran dengan melihat bagaimana indikator RSI bertindak di kawasan oversold, dan untuk mengurangkan kos pembinaan, anda perlu membuat peruntukan secara beransur-ansur apabila terdapat isyarat oversold.
Kelebihan Strategik
- Penempatan sistematik: mengenal pasti peluang perdagangan secara automatik melalui parameter RSI yang telah ditetapkan, mengelakkan bias subjektif yang disebabkan oleh penilaian manusia
- Penyebaran risiko: Menggunakan penubuhan kedudukan berturut-turut, membina beberapa kedudukan pada harga yang berbeza, untuk menyebarkan risiko dengan berkesan
- Kelayakan untuk menyesuaikan diri: parameter strategi boleh disesuaikan dengan keadaan pasaran yang berbeza dan keutamaan risiko individu
- Perlindungan keuntungan: menetapkan sasaran keuntungan yang jelas, menurunkan kedudukan secara automatik apabila mencapai sasaran, mengunci sebahagian keuntungan
- Kecekapan dana: meningkatkan kecekapan penggunaan dana melalui kawalan kedudukan yang munasabah dan mekanisme penambahan dana
Risiko Strategik
- Risiko trend: mungkin sering mencetuskan isyarat binaan di tengah-tengah trend turun yang kuat, yang menyebabkan kehilangan dana
- Parameter sensitif: parameter RSI, peratusan kedudukan yang tidak betul dan sebagainya boleh mempengaruhi prestasi strategi
- Kelikatan pasaran: Dalam pasaran yang kurang kelikatan, mungkin sukar untuk menyelesaikan transaksi pada harga sasaran
- Pengurusan Wang: Terlalu banyak pegangan boleh menyebabkan risiko yang terlalu besar
Penyelesaian:
- Menambah penapis trend, menangguhkan pembinaan gudang dalam trend turun yang jelas
- Tetapan parameter pengoptimuman dengan pengukuran semula
- Tetapkan had pengeluaran maksimum
- Dinamika penyesuaian penambahan nilai simpanan
Arah pengoptimuman strategi
- Parameter dinamik: menyesuaikan parameter RSI dan keadaan kedudukan secara automatik mengikut turun naik pasaran
- Mekanisme Henti Kerosakan: Tambah fungsi Henti Kerosakan Bergerak untuk mengawal risiko dengan lebih baik
- Penapisan pasaran: penambahan syarat penapisan seperti jumlah transaksi, trend, dan lain-lain untuk meningkatkan kualiti isyarat
- Pengoptimuman keluar: reka bentuk mekanisme pengakhiran keuntungan yang lebih fleksibel, seperti pengurangan saham secara beransur-ansur
- Kawalan risiko: Tambah had penarikan maksimum dan kawalan lubang risiko
ringkaskan
Strategi ini mengidentifikasi peluang oversold melalui indikator RSI, menggabungkan kenaikan harga piramida dan peratusan tetap untuk mendapatkan keuntungan, dan membina sistem perdagangan yang lengkap. Kelebihan strategi ini adalah operasi sistematik dan penyebaran risiko, tetapi perlu memperhatikan kesan tren pasaran dan parameter yang ditetapkan terhadap prestasi strategi.
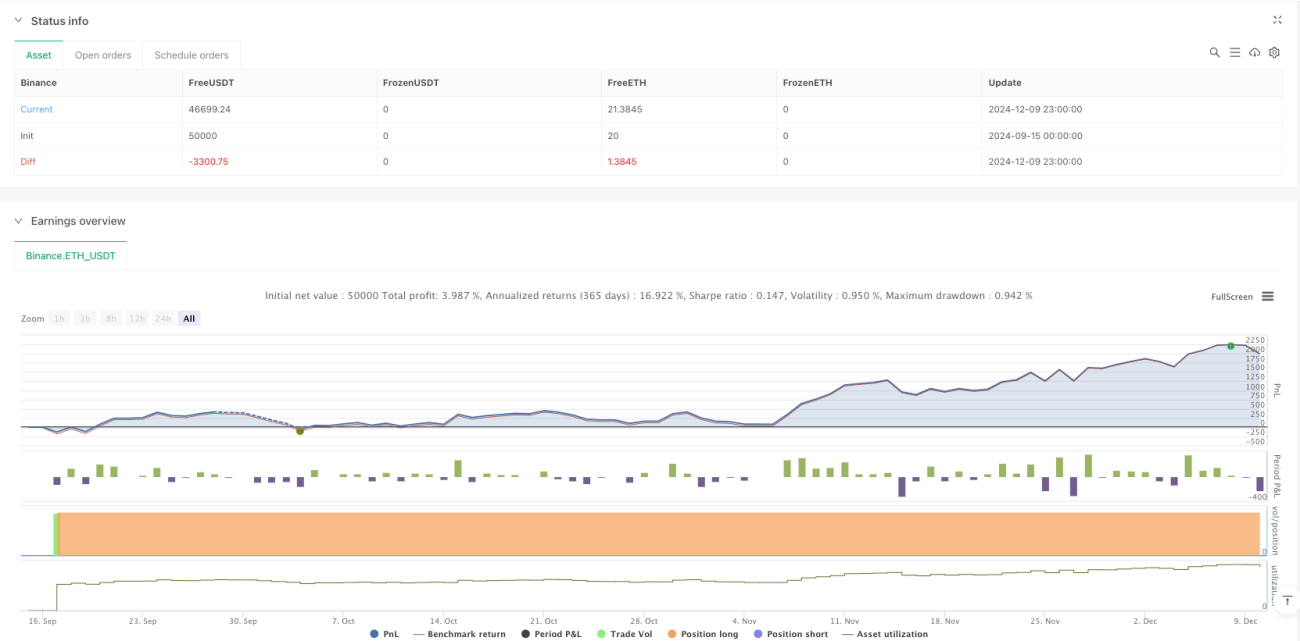
/*backtest
start: 2024-09-15 00:00:00
end: 2024-12-10 00:00:00
period: 1h
basePeriod: 1h
exchanges: [{"eid":"Binance","currency":"ETH_USDT"}]
*/

//@version=5
strategy("RSI Cross Under Strategy", overlay=true, initial_capital=1500, default_qty_type=strategy.percent_of_equity, default_qty_value=6.6)

// Input parameters- 1