Gabungan berbilang penunjuk ATR trailing stop loss strategi perdagangan pintar
ATR EMA VWMA SMA JLines Cloud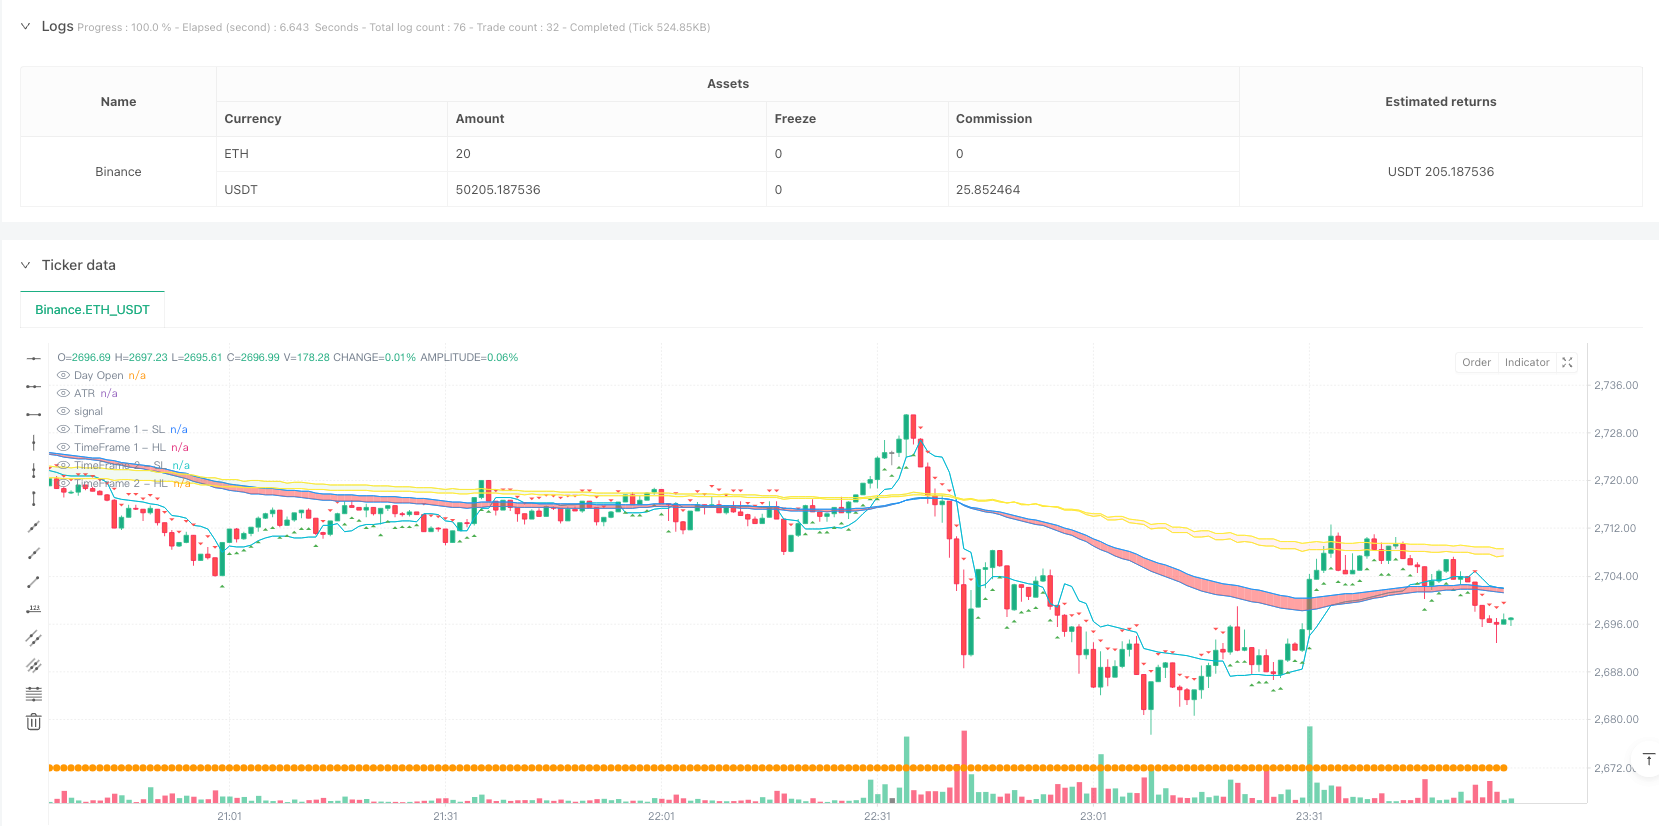
Gambaran keseluruhan
Ini adalah strategi perdagangan pintar yang menggabungkan beberapa petunjuk teknikal, terutamanya berdasarkan petunjuk ATR untuk melaksanakan fungsi pengesanan berhenti. Strategi ini juga mengintegrasikan awan garis rata (JLines Cloud), analisis kuantiti perdagangan dan harga pembukaan dalam sehari dan indikator analisis pelbagai dimensi, sangat sesuai untuk berdagang dalam jangka masa 3 minit dan 5 minit.
Prinsip Strategi
Pusat strategi ini adalah sistem tracking stop loss yang dibina berdasarkan ATR (Average True Range) yang menggunakan 10 kitaran ATR dan 2 kali ganda ATR untuk mengira garis stop loss dinamik. Sistem JLines Cloud yang menggabungkan dua kitaran masa (kombinasi garis rata 72⁄89), dan sistem garis rata 5⁄15 yang boleh dipilih.
- ATR menjejaki penembusan garisan berhenti
- Trend JLines Cloud pada kedua-dua tempoh
- Kedudukan harga berbanding harga pembukaan hari
- Pengesahan jumlah transaksi yang luar biasa
Kelebihan Strategik
- Perlindungan Stop Loss Dinamis - menyediakan perlindungan Stop Loss yang fleksibel untuk menyesuaikan diri dengan turun naik pasaran melalui penunjuk ATR
- Pengesahan trend pelbagai dimensi - menggunakan kombinasi garis rata untuk tempoh masa yang berbeza untuk meningkatkan ketepatan penilaian trend
- Pengesahan jumlah urus niaga - meningkatkan pengesahan urus niaga melalui analisis jumlah urus niaga yang luar biasa
- Pengurusan risiko yang baik - mekanisme perlindungan berganda yang mengandungi sasaran berhenti dan keuntungan yang tetap
- Adaptif - parameter boleh disesuaikan dengan keadaan pasaran yang berbeza
Risiko Strategik
- Sensitiviti parameter - pilihan kitaran ATR dan penggandaan akan mempengaruhi prestasi strategi secara ketara
- Kepercayaan kepada keadaan pasaran - kemungkinan untuk menghasilkan isyarat palsu yang kerap di pasaran horizontal
- Sekatan pelbagai syarat - syarat kemasukan yang ketat boleh menyebabkan kehilangan sebahagian peluang perdagangan
- Kesan slippage - semasa turun naik yang tinggi, harga pelaksanaan sebenar mungkin lebih jauh daripada harga isyarat
Arah pengoptimuman strategi
- Penyesuaian parameter dinamik - ATR boleh disesuaikan secara automatik mengikut turun naik pasaran
- Penapis masa - Tambah penapis masa dagangan untuk mengelakkan pergerakan tinggi pada waktu buka dan tutup pasaran
- Penapisan kekuatan trend - memperkenalkan penunjuk kekuatan trend untuk meningkatkan ketepatan penilaian trend
- Pengurusan risiko yang dioptimumkan - mencapai kadar berhenti dan kehilangan yang dinamik untuk menyesuaikan diri dengan keadaan pasaran yang berbeza
- Peningkatan analisis jumlah urus niaga - kaedah analisis jumlah urus niaga yang lebih halus untuk meningkatkan ketepatan pengesahan urus niaga
ringkaskan
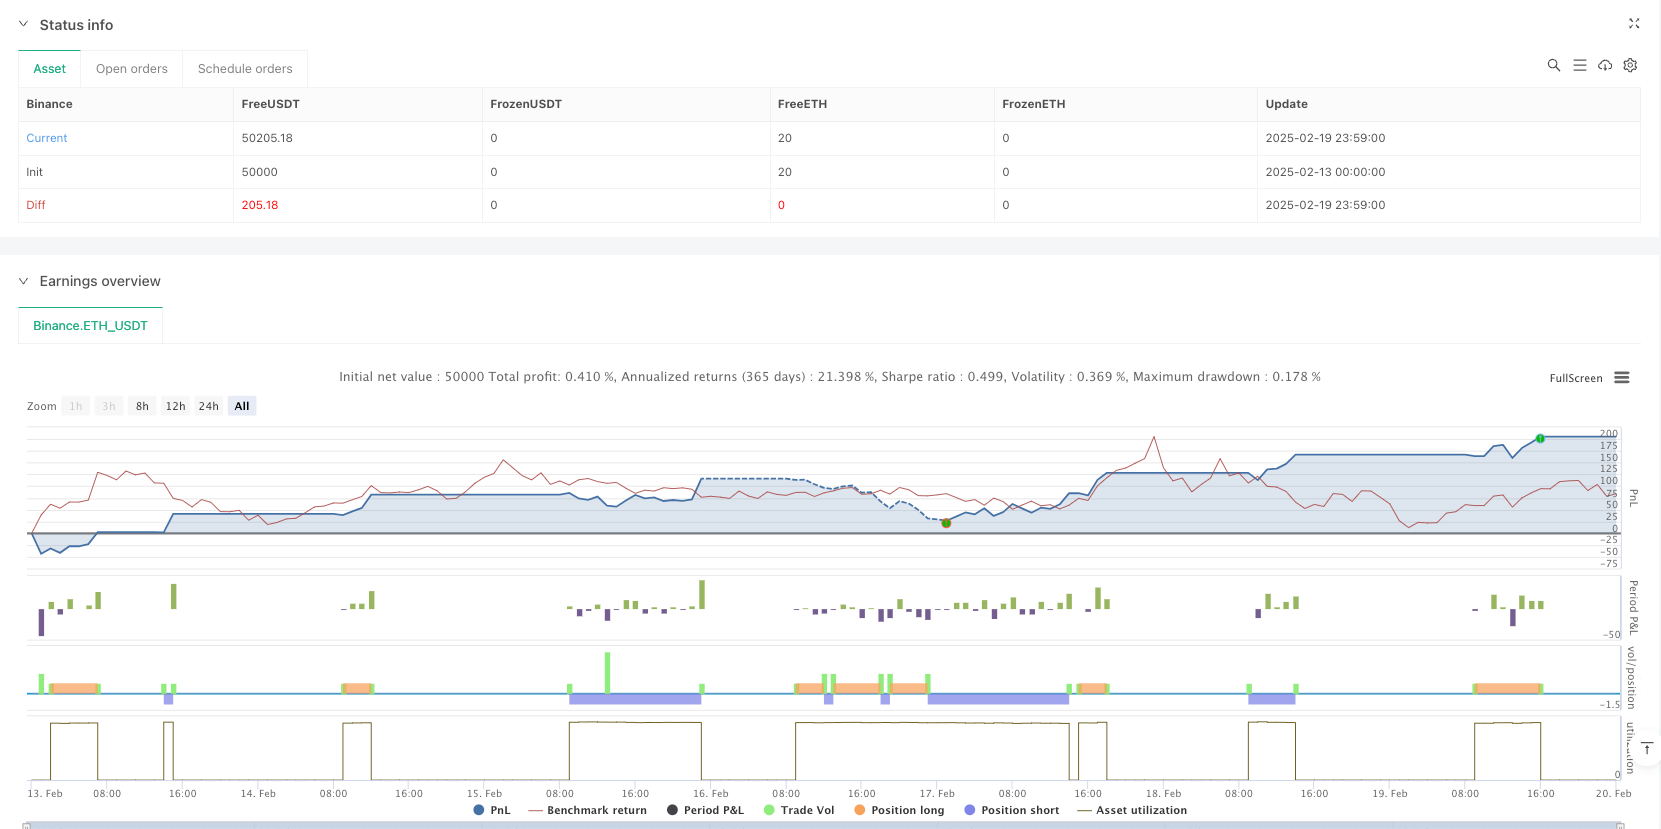
Ini adalah sistem perdagangan lengkap yang menggabungkan pelbagai petunjuk teknikal, menyediakan pengurusan risiko teras melalui ATR yang mengesan kerugian, dan menggunakan awan linear dan analisis jumlah perdagangan untuk mengesahkan perdagangan. Kelebihan strategi adalah kerangka analisis pasaran yang komprehensif dan sistem pengurusan risiko yang baik, tetapi perlu mengoptimumkan parameter untuk keadaan pasaran tertentu. Dengan arah pengoptimuman yang dicadangkan, kestabilan dan keuntungan strategi dijangka meningkat lebih lanjut.
/*backtest
start: 2025-02-13 00:00:00
end: 2025-02-20 00:00:00
period: 1m
basePeriod: 1m
exchanges: [{"eid":"Binance","currency":"ETH_USDT"}]
*/

//@version=6
strategy("AI trade Roney nifty value", overlay=true)

// User Inputs
atrPeriod = input.int(10, "ATR Period")
atrMultiplier = input.float(2, "ATR Multiplier")
target = input.float(40, "Target")
stopLoss = input.float(40, "Stop Loss")

// Calculate ATR-based trailing stop
atr = ta.atr(atrPeriod)
nLoss = atrMultiplier * atr
var float xATRTrailingStop = na

if na(xATRTrailingStop)
    xATRTrailingStop := close - nLoss
else
    if close > xATRTrailingStop[1] and close[1] > xATRTrailingStop[1]
        xATRTrailingStop := math.max(xATRTrailingStop[1], close - nLoss)
    else if close < xATRTrailingStop[1] and close[1] < xATRTrailingStop[1]
        xATRTrailingStop := math.min(xATRTrailingStop[1], close + nLoss)
    else
        xATRTrailingStop := close > xATRTrailingStop[1] ? close - nLoss : close + nLoss

// Define position and entry/exit prices
var int pos = na
pos := close[1] < xATRTrailingStop[1] and close > xATRTrailingStop[1] ? 1 :
       close[1] > xATRTrailingStop[1] and close < xATRTrailingStop[1] ? -1 : pos[1]

var bool isLong = false
var bool isShort = false

var float entryPrice = na
var float exitPrice = na
var float exitStop = na

// JLines Cloud indicator
sl = input.int(72, "Smaller length")
hl = input.int(89, "Higher length")

res = input.timeframe("1", "JLines - Time Frame 1")
res1 = input.timeframe("3", "JLines - Time Frame 2")
enable515 = input.bool(false, "5/15 EMA")
res2 = input.timeframe("5", "5/15 EMA")

ema1_72 = request.security(syminfo.tickerid, res, ta.ema(close, sl))
ema1_89 = request.security(syminfo.tickerid, res, ta.ema(close, hl))
ema2_72 = request.security(syminfo.tickerid, res1, ta.ema(close, sl))
ema2_89 = request.security(syminfo.tickerid, res1, ta.ema(close, hl))
ema3_5 = request.security(syminfo.tickerid, res2, ta.ema(close, 5))
ema3_15 = request.security(syminfo.tickerid, res2, ta.ema(close, 15))

// Plot JLines Cloud
p1_1 = plot(ema1_72, "TimeFrame 1 - SL", color=color.blue, display=display.none)
p1_2 = plot(ema1_89, "TimeFrame 1 - HL", color=color.blue, display=display.none)
p2_1 = plot(ema2_72, "TimeFrame 2 - SL", color=color.yellow, display=display.none)
p2_2 = plot(ema2_89, "TimeFrame 2 - HL", color=color.yellow, display=display.none)
p3_1 = plot(enable515 ? ema3_5 : na, "Late Day Fade - 5 EMA", color=color.yellow, display=display.none)
p3_2 = plot(enable515 ? ema3_15 : na, "Late Day Fade - 15 EMA", color=color.yellow, display=display.none)

fill(p1_1, p1_2, color=ema1_72 > ema1_89 ? color.new(color.green, 30) : color.new(color.red, 30), title="Background 1")
fill(p2_1, p2_2, color=ema2_72 > ema2_89 ? color.new(color.green, 90) : color.new(color.red, 90), title="Background 2")
fill(p3_1, p3_2, color=enable515 ? (ema3_5 > ema3_15 ? color.new(color.blue, 50) : color.new(color.red, 50)) : na, title="Late Day Fade")

// Plot Buy and Sell signals
plotshape(pos == 1, title="Buy", style=shape.triangleup, location=location.belowbar, color=color.green)
plotshape(pos == -1, title="Sell", style=shape.triangledown, location=location.abovebar, color=color.red)

// Volume Analysis
vol_length = input.int(20, "Volume SMA length", minval=1)
vol_avg = ta.sma(volume, vol_length)

unusual_vol_down = volume > vol_avg * 1.2 and close < open
unusual_vol_up = volume > vol_avg * 1.2 and close > open

barcolor(unusual_vol_down or unusual_vol_up ? color.yellow : na)

// ATR Indicator
len2 = input.int(20, minval=1, title="Smooth")
src = input.source(close, title="Source")
out = ta.vwma(src, len2)
avg1 = math.avg(out, xATRTrailingStop) // FIXED: Replaced `ta.avg()` with `math.avg()`

plot(avg1, color=color.aqua, title="ATR")

// Daily Open Line
dl = input.bool(true, "Show daily Open")
dopen = request.security(syminfo.tickerid, "D", open)
plot(dl ? dopen : na, title="Day Open", color=color.orange, style=plot.style_circles, linewidth=2)

// Strategy Entry Conditions
if pos == 1 and not isLong and ema1_72 > ema1_89 and ema2_72 > ema2_89 and ema1_72 > ema2_72 and close > dopen
    entryPrice := close
    exitPrice := close + target
    exitStop := entryPrice - stopLoss
    strategy.entry("Buy", strategy.long)
    strategy.exit("buy_target", "Buy", limit=exitPrice)
    isLong := true
    isShort := false

if pos == -1 and not isShort and ema1_72 < ema1_89 and ema2_72 < ema2_89 and ema1_72 < ema2_72 and close < dopen
    entryPrice := close
    exitPrice := close - target
    exitStop := entryPrice + stopLoss
    strategy.entry("Sell", strategy.short)
    strategy.exit("Sell_target", "Sell", limit=exitPrice)
    isLong := false
    isShort := true

// Stop Loss Handling
if strategy.position_size > 0 and close < entryPrice - stopLoss
    strategy.close("Buy", comment="Buy_Stop Loss")

if strategy.position_size < 0 and close > entryPrice + stopLoss
    strategy.close("Sell", comment="Sell_Stop Loss")