
Gambaran keseluruhan
Strategi ini adalah sistem perdagangan trend-tracking yang menggabungkan beberapa petunjuk teknikal. Ia menangkap pergerakan trend melalui MACD, menggunakan RSI dan StochRSI untuk mengesahkan status overbought dan oversold, dan menggunakan indikator kuantiti transaksi untuk mengesahkan kesahihan isyarat perdagangan.
Prinsip Strategi
Logik teras strategi adalah berdasarkan elemen utama berikut:
- Penunjuk MACD digunakan untuk mengenal pasti trend harga dan perubahan dinamik, menghasilkan isyarat perdagangan awal melalui persilangan garis cepat dan perlahan
- Penunjuk RSI sebagai alat pengesahan trend yang membantu menentukan sama ada pasaran berada dalam keadaan yang kuat (<50) atau lemah (<50)
- StochRSI menyediakan maklumat dinamik pasaran yang lebih sensitif dengan pengiraan RSI secara rawak
- Mekanisme pengesahan jumlah transaksi memerlukan jumlah transaksi yang berlaku mestilah lebih tinggi daripada 1.5 kali jumlah transaksi rata-rata 14 kitaran
Sistem ini membuka lebih banyak kedudukan apabila syarat berikut dipenuhi:
- MACD dalam talian pantas melalui talian perlahan
- RSI terletak di atas 50
- StochRSI melalui garis D pada garis K
- Jumlah dagangan semasa melebihi nilai terendah
Sistem membuka kedudukan kosong apabila syarat berikut dipenuhi:
- MACD dalam garis laju melalui garis lambat
- RSI di bawah 50
- StochRSI di bawah K melalui D
- Jumlah dagangan semasa melebihi nilai terendah
Kelebihan Strategik
- Gabungan pelbagai petunjuk teknikal menyediakan isyarat dagangan yang lebih dipercayai dan mengurangkan risiko isyarat palsu
- Mekanisme pengesahan jumlah transaksi menyaring peluang perdagangan yang kurang cair di pasaran
- Parameter strategi boleh laras dengan mudah untuk mengoptimumkan mengikut keadaan pasaran yang berbeza
- Kombinasi trend tracking dan strategi momentum membolehkan anda menangkap trend besar dan tidak terlepas peluang jangka pendek.
- Logik kemasukan yang jelas untuk menjalankan dan mengesahkan pengesahan
Risiko Strategik
- Penapisan pelbagai indikator boleh menyebabkan kehilangan beberapa peluang dagangan yang berpotensi
- Isyarat pelarian palsu yang kerap mungkin berlaku dalam pasaran yang tidak menentu
- Tidak ada mekanisme hentian dan penangguhan kerugian, meningkatkan risiko pengurusan wang
- Bergantung pada jumlah transaksi sejarah sebagai rujukan, mungkin tidak sah dalam keadaan yang tidak biasa
- Penumpukan keterbelakangan pelbagai petunjuk teknikal boleh menyebabkan penarikan masa yang terlewat
Cadangan kawalan risiko:
- Tambah mekanisme henti rugi dan ambil untung
- Memperkenalkan penapis trend
- Kombinasi parameter penunjuk optimum
- Tetapkan had tempoh maksimum
- Menerapkan strategi pembinaan gudang secara berturutan
Arah pengoptimuman strategi
- Memperkenalkan mekanisme pengoptimuman parameter yang menyesuaikan diri, membolehkan strategi menyesuaikan parameter penunjuk secara automatik mengikut keadaan pasaran
- Menambah penapis kadar turun naik pasaran, menggunakan peraturan perdagangan yang berbeza dalam persekitaran turun naik yang berbeza
- Memperbaiki sistem pengurusan dana, menyertai pengurusan kedudukan dinamik dan mekanisme kawalan risiko
- Pembangunan algoritma penapisan pintar untuk mengurangkan isyarat palsu dalam pasaran yang bergolak
- Mengintegrasikan penunjuk sentimen pasaran untuk meningkatkan ketepatan isyarat perdagangan
ringkaskan
Strategi ini membina sistem perdagangan yang agak lengkap melalui kerjasama kerjasama antara beberapa petunjuk teknikal. Penambahan mekanisme pengesahan kuantiti transaksi meningkatkan kebolehpercayaan isyarat perdagangan, tetapi sistem masih perlu diperbaiki dalam pengendalian risiko dan pengoptimuman parameter. Kelebihan utama strategi ini adalah kejernihan logiknya, kebolehaturan yang kuat, dan kesesuaian untuk pengoptimuman dan pengembangan lebih lanjut sebagai kerangka asas.
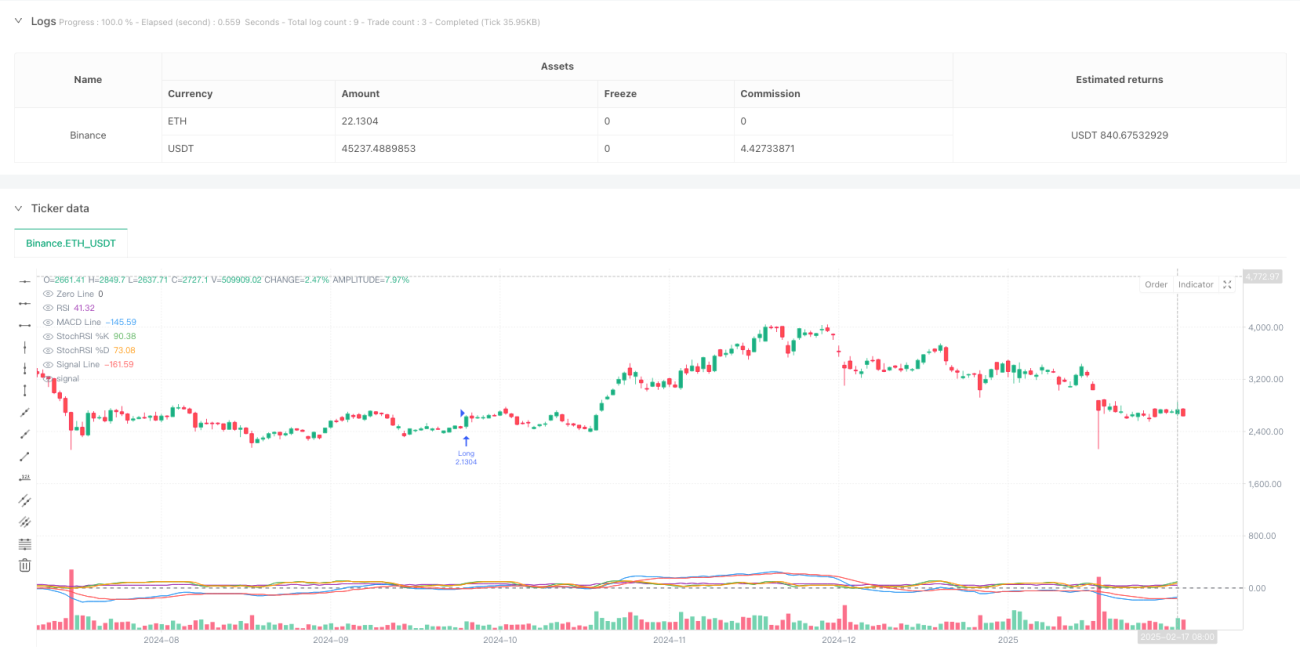
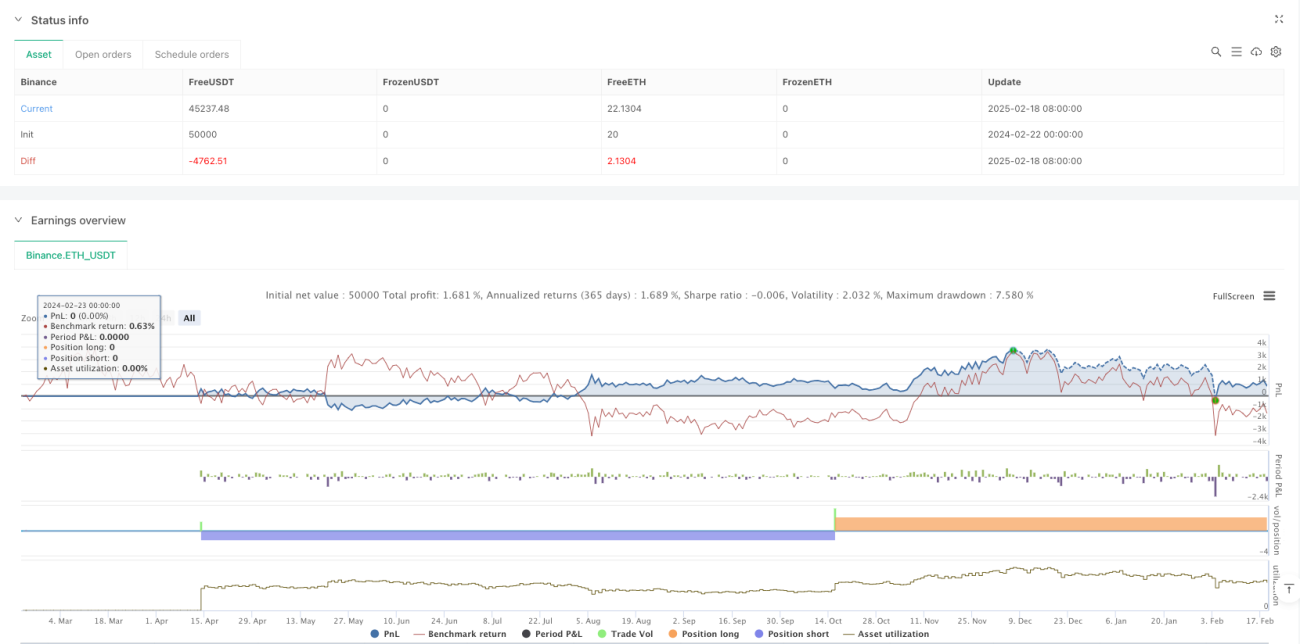
/*backtest
start: 2024-02-22 00:00:00
end: 2025-02-19 08:00:00
period: 1d
basePeriod: 1d
exchanges: [{"eid":"Binance","currency":"ETH_USDT"}]
*/

//@version=5
strategy("BTCUSDT Strategy with Volume, MACD, RSI, StochRSI", overlay=true, default_qty_type=strategy.percent_of_equity, default_qty_value=10)

// Input parameters- 1