
Gambaran keseluruhan
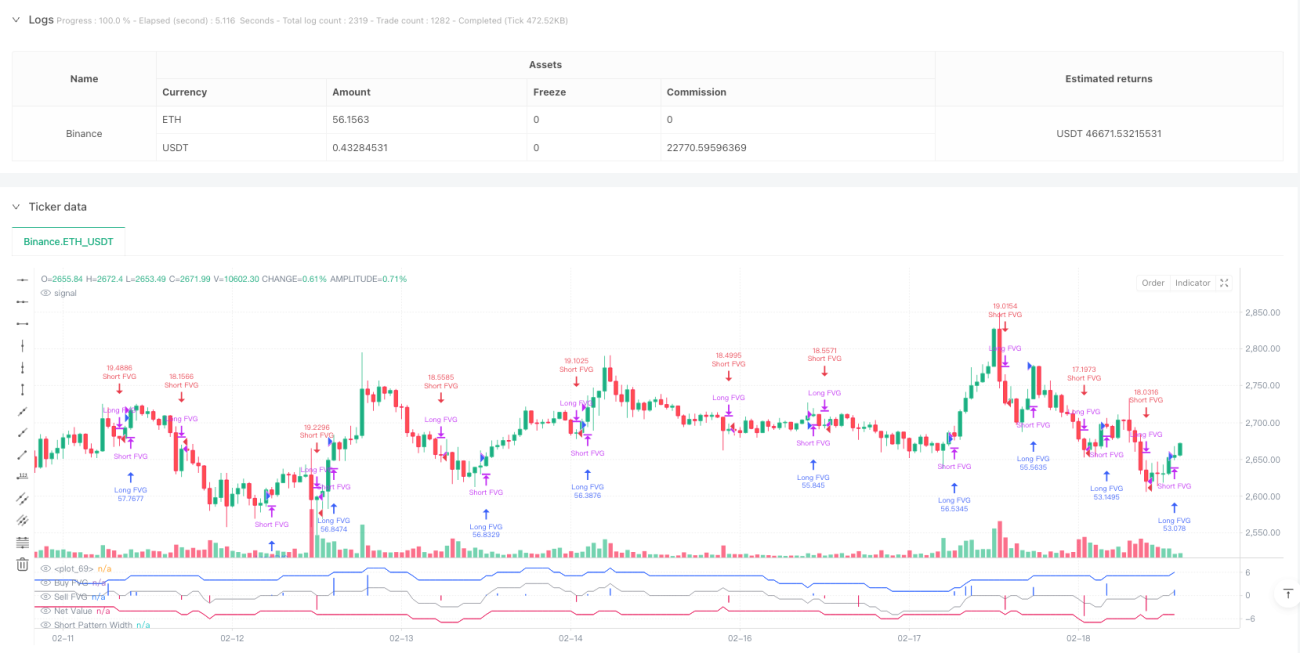
Strategi ini adalah sistem perdagangan inovatif yang berasaskan jurang nilai wajar (FVG) untuk menangkap peluang perdagangan yang berpotensi dengan mengenal pasti jurang harga dan ketidaksuburan dalam pasaran. Strategi ini menggabungkan mekanisme pengiraan dinamik dan pemprosesan standardisasi, bukan sahaja dapat mengenal pasti isyarat jual beli, tetapi juga dapat membantu pedagang memahami struktur pasaran dengan lebih baik melalui paparan visual.
Prinsip Strategi
Inti strategi ini adalah untuk mengenal pasti peluang perdagangan yang berpotensi dengan memantau jurang harga antara K-Line yang berturut-turut.
- Keadaan pembentukan BFVG ialah harga terendah pada garis K semasa lebih tinggi daripada harga tertinggi sebelum dua garis K
- Keadaan pembentukan FVG kosong ialah harga tertinggi pada garis K semasa lebih rendah daripada harga terendah sebelum dua garis K
- Strategi memperkenalkan mekanisme pengesahan berdasarkan jumlah transaksi dan saiz lubang, dan hanya FVG yang memenuhi syarat pengesahan yang akan mencetuskan isyarat perdagangan
- Menggunakan tetingkap kiraan dinamik 50 kitaran untuk mengumpul jumlah FVG kosong
- Mengubah lebar lubang ke nilai penunjuk yang lebih intuitif dengan pemprosesan standard
Kelebihan Strategik
- Sistem ini mempunyai mekanisme pengesahan isyarat yang baik untuk meningkatkan kualiti isyarat dengan pengesahan dua kali ganda untuk jumlah transaksi dan lebar lubang
- Jendela pengira dinamik dapat menangkap perubahan trend pasaran dengan berkesan
- Pemprosesan kesatuan membolehkan isyarat dari tempoh yang berbeza untuk dibandingkan
- Strategi ini mempunyai fungsi pengurusan kedudukan automatik yang secara automatik melonggarkan pegangan terbalik sebelum membuka kedudukan baru
- Kesan visual yang baik untuk membantu pedagang memahami keadaan pasaran
Risiko Strategik
- Isyarat FVG mungkin menghasilkan isyarat palsu dalam pasaran yang bergolak tinggi
- Parameter pengesahan tetap mungkin tidak sesuai untuk semua keadaan pasaran
- Tidak ada mekanisme hentian dan hentian yang ditetapkan, yang boleh menyebabkan penarikan balik yang lebih besar
- Perdagangan yang kerap boleh membawa kepada kos yang lebih tinggi
Ia disyorkan untuk menguruskan risiko ini dengan menetapkan kedudukan hentian yang sesuai dan memperkenalkan penapis persekitaran pasaran.
Arah pengoptimuman strategi
- Memperkenalkan mekanisme penyesuaian parameter yang bersesuaian untuk membolehkan strategi lebih sesuai dengan keadaan pasaran yang berbeza
- Menambah penapis trend, hanya berdagang satu arah dalam trend yang kuat
- Reka bentuk sistem pengurusan gudang yang lebih kompleks, termasuk gudang yang dibangunkan secara berturut-turut dan hentikan kerugian yang dinamik
- Mengambil kira kos transaksi dan mengoptimumkan kekerapan transaksi
- Meningkatkan kebolehpercayaan isyarat dalam kombinasi dengan petunjuk teknikal lain
ringkaskan
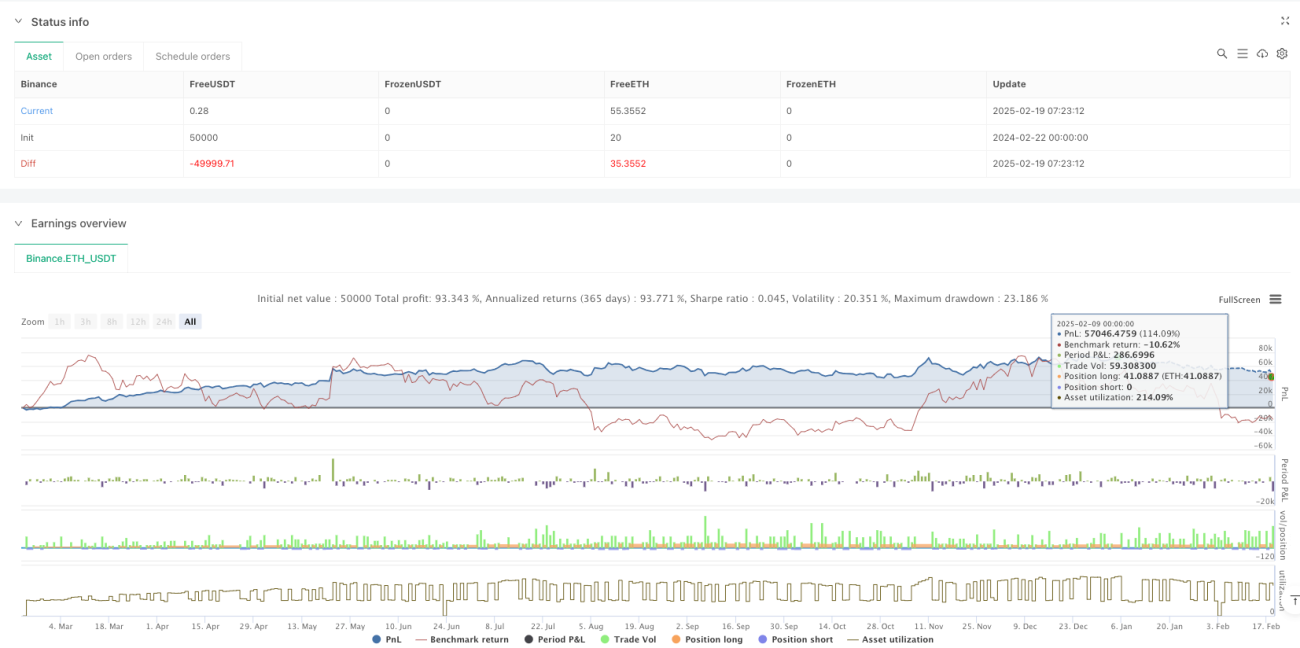
Ini adalah strategi perdagangan inovatif berdasarkan struktur harga, untuk menangkap peluang pasaran dengan pengenalan dan pengesahan yang bijak terhadap jurang nilai adil. Strategi ini direka dengan konsep yang jelas, profesional dalam cara pelaksanaannya, dan mempunyai skalabiliti yang baik. Dengan arah pengoptimuman yang disyorkan, kestabilan dan keuntungan strategi ini dijangka dapat ditingkatkan lagi.
/*backtest
start: 2024-02-22 00:00:00
end: 2025-02-19 08:00:00
period: 1h
basePeriod: 1h
exchanges: [{"eid":"Binance","currency":"ETH_USDT"}]
*/

// ----------------------------------------------------------------------------
// This Pine Script™ code is subject to the terms of the Mozilla Public License
// 2.0 at https://mozilla.org/MPL/2.0/
// © OmegaTools- 1