
Gambaran Keseluruhan
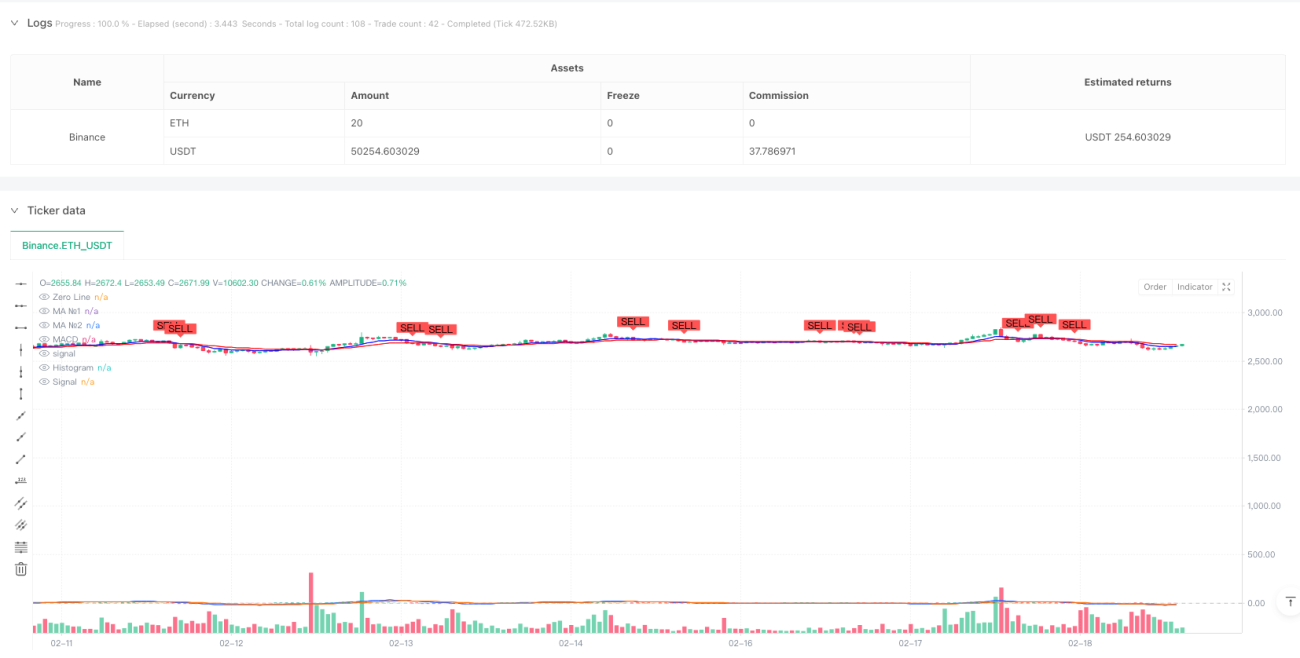
Strategi ini adalah sistem perdagangan yang menggabungkan jalur purata bergerak berbilang tempoh dan penunjuk MACD. Strategi ini terutamanya menggunakan persilangan purata bergerak jangka pendek dan panjang serta isyarat penunjuk MACD untuk menentukan arah aliran pasaran dan masa perdagangan. Strategi ini disepadukan dengan logik penetapan semula dagangan intrahari, yang berkesan dapat mengelakkan risiko semalaman.
Prinsip Strategi
Logik teras strategi merangkumi tiga bahagian utama: sistem jalur purata bergerak, sistem penunjuk MACD, dan mekanisme penetapan semula dagangan intrahari. Jalur purata bergerak terdiri daripada dua purata bergerak dengan tempoh berbeza (9 dan 21), dan menyokong pelbagai jenis purata bergerak termasuk SMA, EMA, SMMA, WMA dan VWMA. Sistem MACD menggunakan tetapan parameter standard 12/26/9, dan menilai momentum arah aliran melalui perbezaan antara garis cepat dan garis perlahan serta garis isyarat. Isyarat beli memerlukan kedua-dua syarat: purata bergerak jangka pendek melintasi ke atas purata bergerak jangka panjang dan garis MACD melintasi ke atas garis isyarat, manakala isyarat jual dicetuskan apabila berlaku sebarang persilangan songsang. Pada permulaan setiap hari dagangan, status isyarat akan ditetapkan semula untuk memastikan kesinambungan dan keselamatan dagangan.
Kelebihan Strategi
- Keyakinan isyarat berganda yang boleh dipercayai: Menggabungkan penjejakan arah aliran dan penunjuk momentum, dengan ketara mengurangkan risiko isyarat palsu.
- Konfigurasi parameter yang fleksibel: Menyokong pelbagai jenis purata bergerak, membolehkan pengoptimuman mengikut ciri pasaran yang berbeza.
- Kawalan risiko yang lengkap: Mengandungi mekanisme penetapan semula dagangan intrahari, berkesan mengelakkan risiko semalaman.
- Kesan visual yang menonjol: Disepadukan dengan tanda isyarat beli/jual yang jelas dan paparan jalur purata bergerak, memudahkan keputusan dagangan.
Risiko Strategi
- Kelewatan perubahan arah aliran: Oleh kerana menggunakan sistem purata bergerak, mungkin bertindak balas dengan perlahan apabila pasaran berubah dengan pantas.
- Tidak sesuai untuk pasaran berombak: Dalam pasaran yang bergerak secara melintang, mungkin menghasilkan isyarat palsu yang kerap.
- Kesukaran pengoptimuman parameter: Parameter optimum mungkin berbeza dengan ketara dalam persekitaran pasaran yang berbeza.
- Kesan kelewatan pelaksanaan: Dalam pasaran yang sangat tidak menentu, mungkin terdapat perbezaan harga yang besar antara pengesahan isyarat dan pelaksanaan sebenar.
Arah Pengoptimuman Strategi
- Memperkenalkan penapisan turun naik: Adalah disyorkan untuk menambah penunjuk ATR atau turun naik, dan melaraskan ambang pencetus isyarat dalam persekitaran turun naik yang tinggi.
- Mengoptimumkan mekanisme pengesahan isyarat: Boleh mempertimbangkan untuk menambah pengesahan volum dagangan atau pengesahan corak harga untuk meningkatkan kebolehpercayaan isyarat.
- Menambah baik pengurusan risiko: Adalah disyorkan untuk menambah henti rugi dinamik dan sasaran untung untuk meningkatkan nisbah risiko-pulangan strategi.
- Penyesuaian persekitaran pasaran: Boleh melaraskan parameter secara dinamik mengikut keadaan pasaran yang berbeza untuk meningkatkan kebolehsuaian strategi.
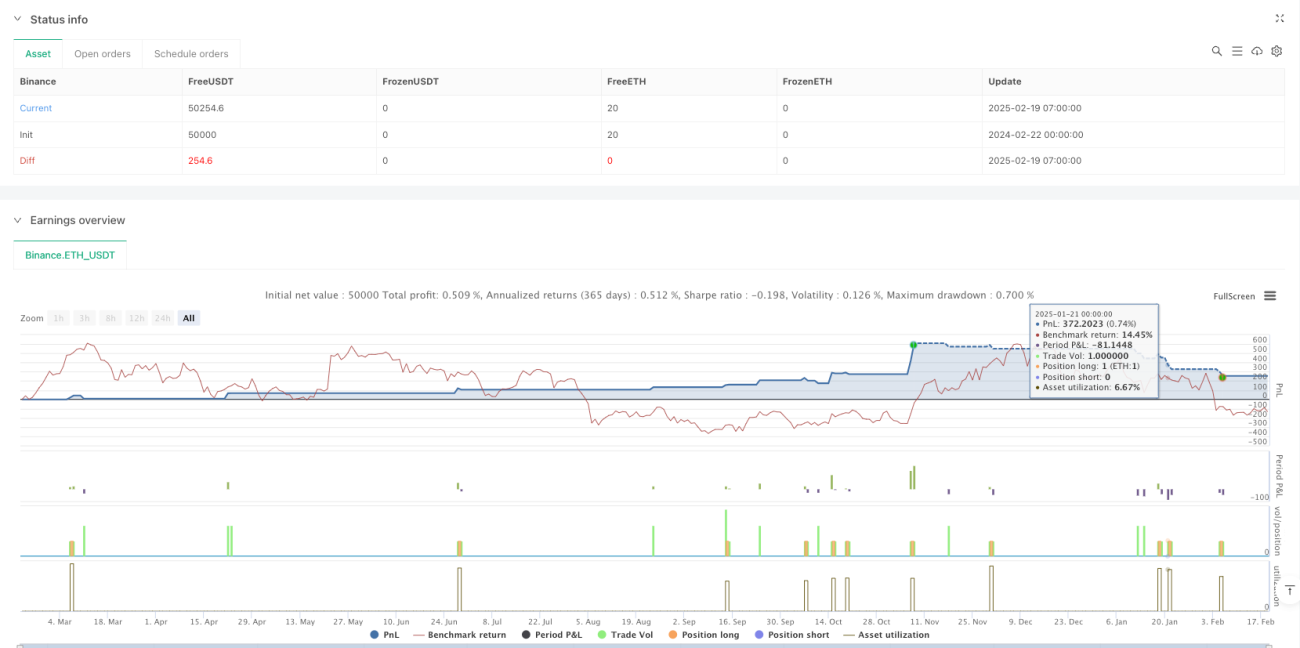
Kesimpulan
Strategi ini membina sistem perdagangan yang agak lengkap dengan menggabungkan jalur purata bergerak dan penunjuk MACD. Walaupun terdapat risiko kelewatan tertentu, dengan pengoptimuman parameter dan pengurusan risiko yang sesuai, strategi ini boleh mencapai keputusan yang baik dalam pasaran yang mengikuti arah aliran. Adalah disyorkan agar pedagang menjalankan ujian semula yang mencukupi sebelum menggunakan secara langsung, dan melaraskan tetapan parameter mengikut ciri pasaran tertentu.
- 1