Strategi Persilangan Purata Pergerakan Eksponen Aliran Dinamik
EMA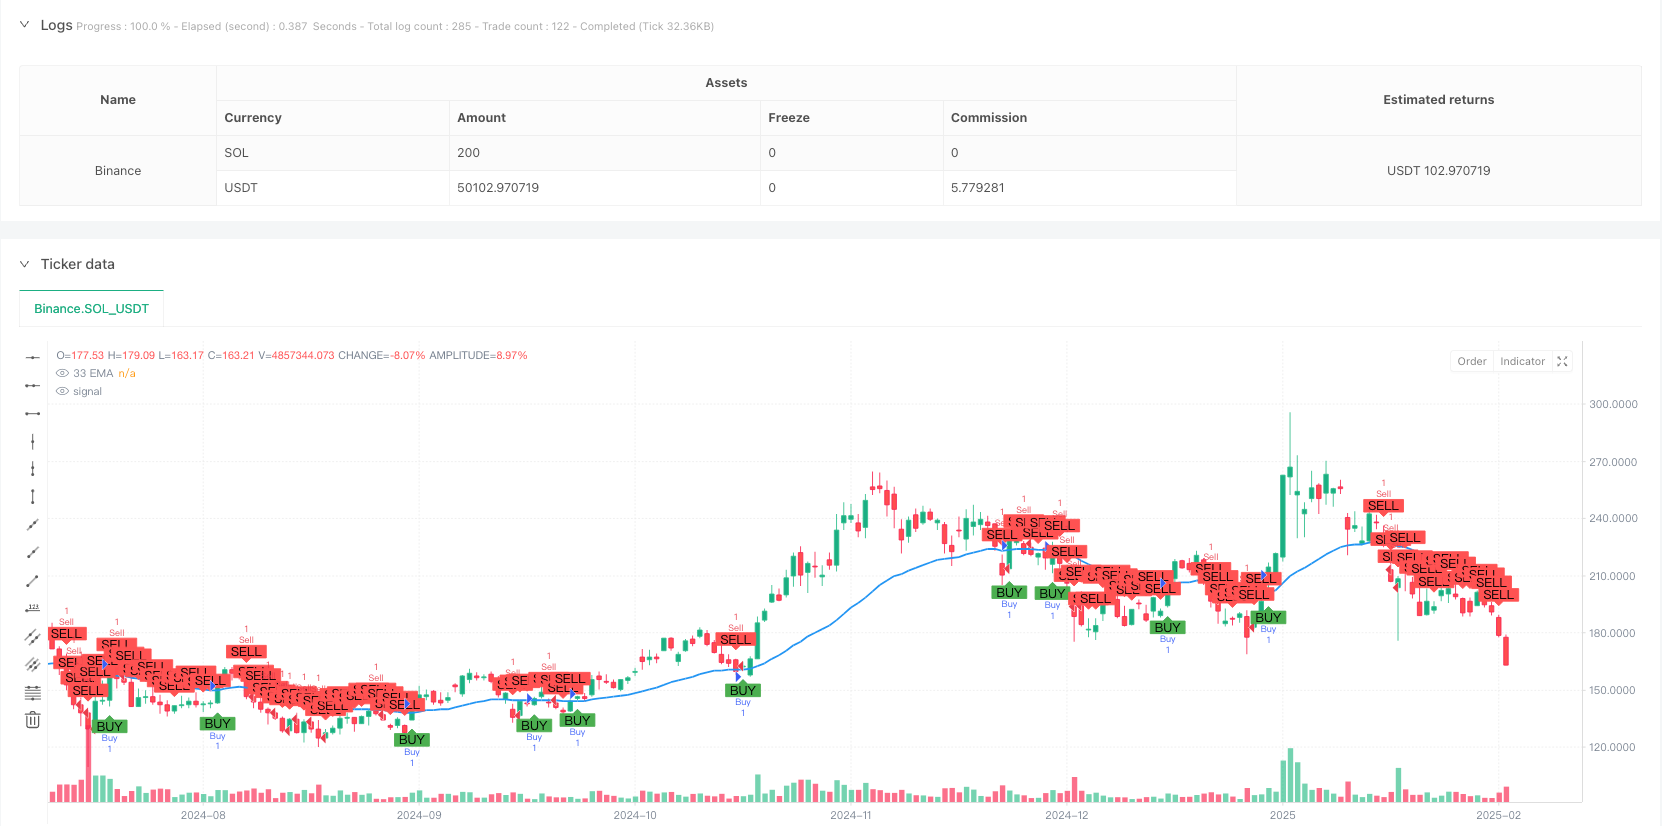
Gambaran keseluruhan
Strategi ini adalah sistem perdagangan trend-tracking berdasarkan 33-siklus indeks moving averages (EMA). Ia mengenal pasti perubahan trend pasaran melalui hubungan silang antara harga dan EMA, dan menetapkan kedudukan hentian hentian yang digabungkan dengan titik rendah dan tinggi yang bergelombang, untuk mengesan pergerakan trend dan mengawal risiko.
Prinsip Strategi
Logik teras strategi ini adalah untuk menilai arah trend dengan melihat hubungan silang harga dengan EMA 33 kitaran. Apabila harga penutupan menembusi ke atas dan menstabilkan EMA, ia akan mencetuskan beberapa isyarat; apabila harga penutupan menembusi ke bawah dan menembusi EMA, ia akan mencetuskan isyarat penyingkiran.
Kelebihan Strategik
- Isyarat jelas: menggunakan EMA cross sebagai isyarat perdagangan, menilai piawaian dengan jelas objektif, mengelakkan dugaan subjektif.
- Pengurusan dinamik: menyesuaikan kedudukan hentian hentian secara dinamik melalui ketinggian dan ketinggian turun naik, menyesuaikan diri dengan ciri-ciri turun naik pasaran.
- Risiko boleh dikawal: Setiap dagangan mempunyai kedudukan hentian yang jelas yang dapat mengawal risiko dengan berkesan.
- Pengesanan Trend: Dengan ciri-ciri trend EMA, trend jangka menengah dan jangka panjang dapat difahami dengan lebih baik.
- Pengoptimuman parameter: parameter utama boleh disesuaikan untuk memudahkan pengoptimuman mengikut ciri-ciri pasaran yang berbeza.
Risiko Strategik
- Kerugian di pasaran goyah: Dalam pasaran goyah berdekatan, persilangan yang kerap boleh menyebabkan kerugian berterusan.
- Risiko keterbelakangan: EMA mempunyai keterbelakangan dan mungkin terlepas titik harga penting pada awal trend.
- Risiko penembusan palsu: turun naik harga jangka pendek boleh menyebabkan penembusan palsu yang menyebabkan isyarat yang salah.
- Stop loss margin: Menggunakan paras paras turun naik sebagai titik stop loss, dalam beberapa kes, stop loss margin mungkin lebih besar.
Arah pengoptimuman strategi
- Memperkenalkan penapis trend: anda boleh menambah garis purata kitaran yang lebih lama atau penunjuk trend untuk menapis isyarat perdagangan dari pasaran yang bergolak.
- Peningkatan masa masuk ke dalam pasaran: menggabungkan RSI dan lain-lain penunjuk pergerakan untuk masuk ke dalam pasaran pada kedudukan harga yang lebih baik.
- Optimumkan tetapan hentian: Anda boleh mempertimbangkan untuk menggunakan ATR untuk menyesuaikan jarak hentian secara dinamik, menjadikan kawalan angin lebih fleksibel.
- Meningkatkan pengesahan jumlah transaksi: Menambah analisis jumlah transaksi, meningkatkan kebolehpercayaan isyarat.
- Memperbaiki mekanisme keluar: reka bentuk keadaan keluar yang lebih halus, seperti pengenalan hentian bergerak.
ringkaskan
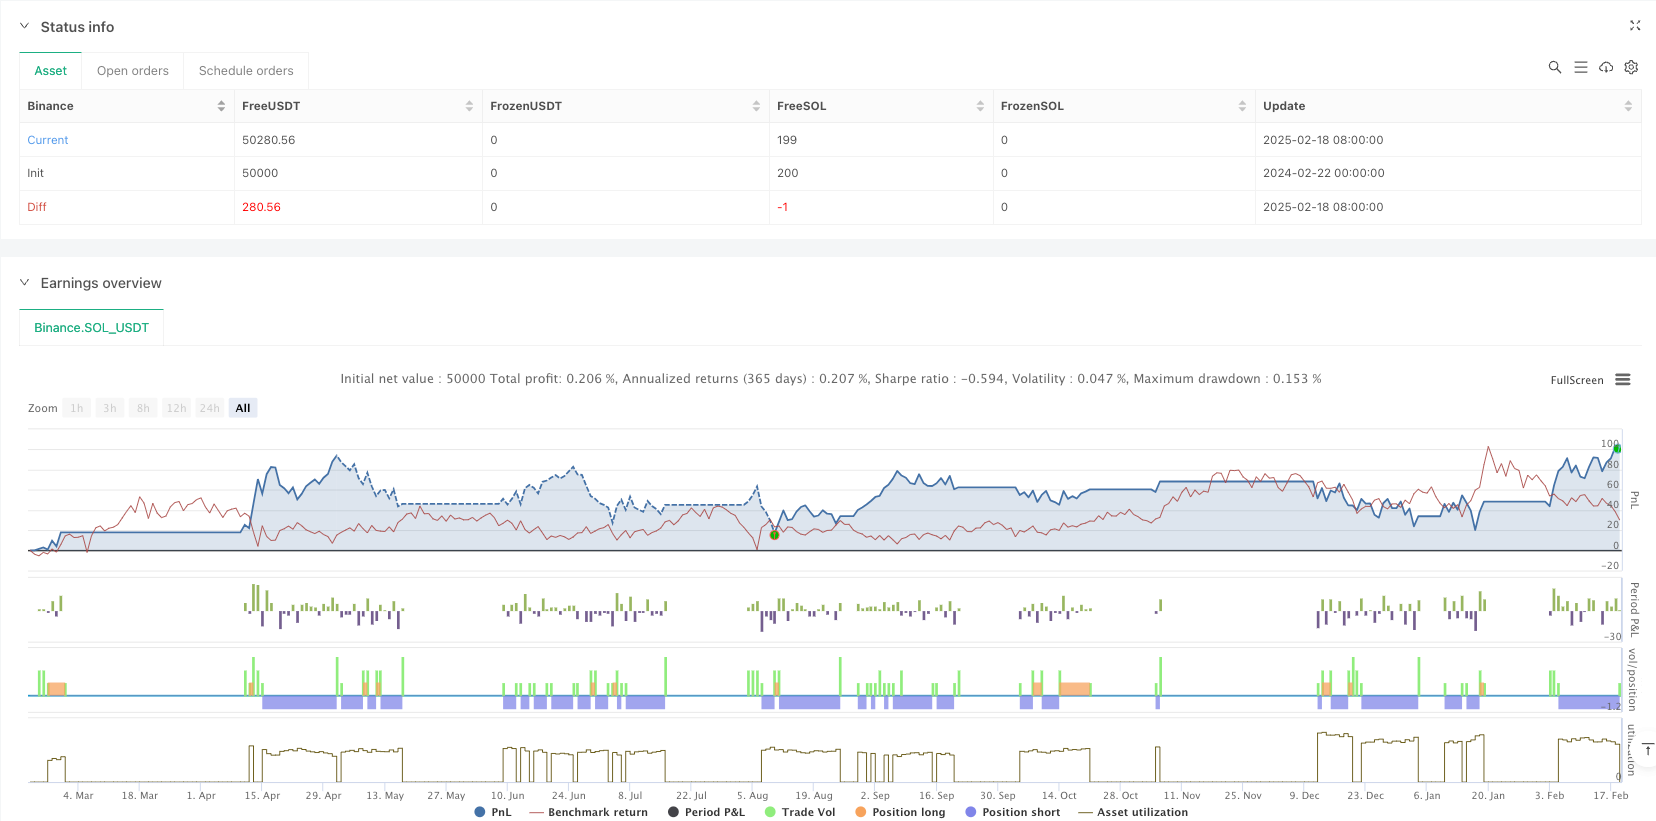
Ini adalah strategi penjejakan trend yang berstruktur, logik dan jelas. Ia mempunyai kegunaan yang baik untuk menangkap trend melalui EMA, menguruskan risiko dengan titik rendah dan tinggi yang bergelombang. Walaupun terdapat beberapa batasan yang wujud, tetapi dengan arah pengoptimuman yang disyorkan, anda dapat meningkatkan lagi kestabilan dan keuntungan strategi.
/*backtest
start: 2024-02-22 00:00:00
end: 2025-02-19 08:00:00
period: 1d
basePeriod: 1d
exchanges: [{"eid":"Binance","currency":"SOL_USDT"}]
*/

// This Pine Script™ code is subject to the terms of the Mozilla Public License 2.0 at https://mozilla.org/MPL/2.0/
// © GlenMabasa

//@version=6
strategy("33 EMA Crossover Strategy", overlay=true)

// Input for the EMA length
ema_length = input.int(33, title="EMA Length")

// Calculate the 33-day Exponential Moving Average
ema_33 = ta.ema(close, ema_length)

// Plot the 33 EMA
plot(ema_33, color=color.blue, title="33 EMA", linewidth=2)

// Buy condition: Price crosses and closes above the 33 EMA
buy_condition = ta.crossover(close, ema_33) and close > ema_33

// Sell condition: Price crosses or closes below the 33 EMA
sell_condition = ta.crossunder(close, ema_33) or close < ema_33

// Swing high and swing low calculations
swing_high_length = input.int(14, title="Swing High Lookback")
swing_low_length = input.int(14, title="Swing Low Lookback")
swing_high = ta.highest(high, swing_high_length) // Previous swing high
swing_low = ta.lowest(low, swing_low_length)    // Previous swing low

// Profit target and stop loss for buys
buy_profit_target = swing_high
buy_stop_loss = swing_low

// Profit target and stop loss for sells
sell_profit_target = swing_low
sell_stop_loss = swing_high

// Plot buy and sell signals
plotshape(series=buy_condition, title="Buy Signal", location=location.belowbar, color=color.green, style=shape.labelup, text="BUY")
plotshape(series=sell_condition, title="Sell Signal", location=location.abovebar, color=color.red, style=shape.labeldown, text="SELL")

// Strategy logic for backtesting
if (buy_condition)
    strategy.entry("Buy", strategy.long)
    strategy.exit("Take Profit/Stop Loss", "Buy", limit=buy_profit_target, stop=buy_stop_loss)

if (sell_condition)
    strategy.entry("Sell", strategy.short)
    strategy.exit("Take Profit/Stop Loss", "Sell", limit=sell_profit_target, stop=sell_stop_loss)